
Compare Symbiox Investme with Similar Stocks
Stock DNA
Non Banking Financial Company (NBFC)
INR 5 Cr (Micro Cap)
36.00
24
0.00%
0.00
0.47%
0.16
Total Returns (Price + Dividend) 
Symbiox Investme for the last several years.
Risk Adjusted Returns v/s
Returns Beta

News
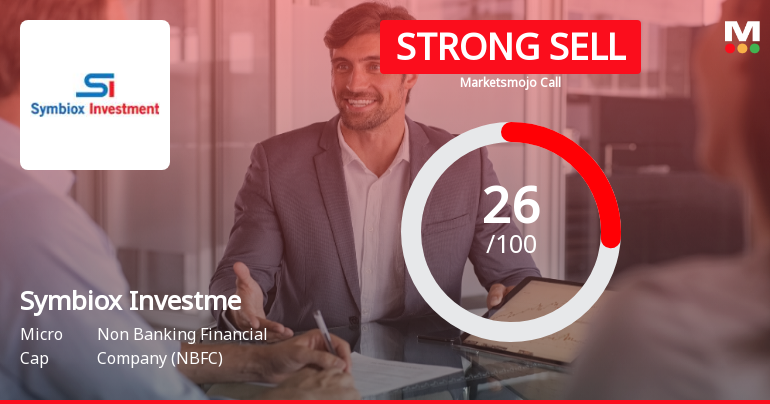
Symbiox Investment & Trading Co Ltd Downgraded to Strong Sell Amid Weak Fundamentals and Bearish Technicals
Symbiox Investment & Trading Co Ltd, a micro-cap player in the Non Banking Financial Company (NBFC) sector, has seen its investment rating downgraded from Sell to Strong Sell as of 10 June 2026. This shift reflects deteriorating technical indicators, stagnant financial performance, and weak long-term fundamentals, signalling heightened risks for investors amid a challenging market environment.
Read full news article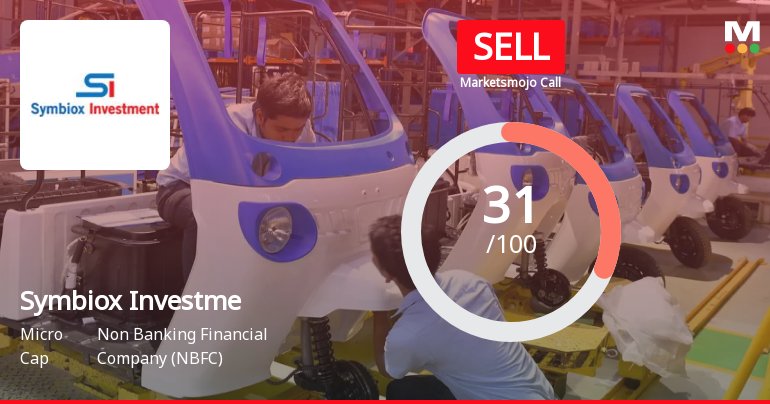
Symbiox Investment & Trading Co Ltd Upgraded to Sell on Technical Improvements
Symbiox Investment & Trading Co Ltd, a micro-cap player in the Non Banking Financial Company (NBFC) sector, has seen its investment rating upgraded from Strong Sell to Sell as of 5 June 2026. This change reflects a nuanced shift in the company’s technical outlook, even as its fundamental and financial trends remain subdued. The upgrade is primarily driven by improved technical indicators, while valuation and financial performance continue to pose challenges for investors.
Read full news article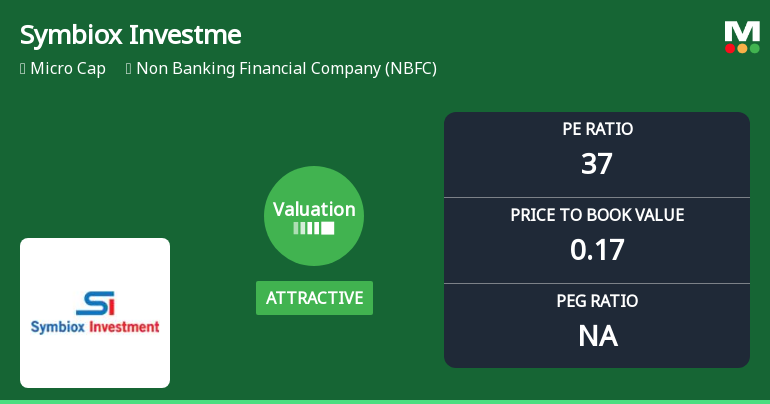
Symbiox Investment & Trading Co Ltd Valuation Shifts Signal Renewed Price Attractiveness
Symbiox Investment & Trading Co Ltd, a micro-cap player in the Non Banking Financial Company (NBFC) sector, has witnessed a notable shift in its valuation parameters, moving from a risky to an attractive valuation grade. This change, driven primarily by its price-to-book value and price-to-earnings ratio, signals a potential reappraisal of the stock’s price attractiveness despite ongoing challenges in profitability and market performance.
Read full news article Announcements
Compliances-Reg.24(A)-Annual Secretarial Compliance
30-May-2026 | Source : BSEAnnual Secretarial Compliance Report under Regulation 24A for the financial year ended 31.03.2026
Results-Financial For The Year 31.03.2026
29-May-2026 | Source : BSEpfa
Announcement under Regulation 30 (LODR)-Change in Management
23-May-2026 | Source : BSEpfa
Corporate Actions

No Upcoming Board Meetings

No Dividend history available

No Splits history available

No Bonus history available

No Rights history available
Quality key factors
Valuation key factors
Technicals key factors
 Technical Indicator Scale: Bearish, Mildly Bearish, Sideways, Mildly Bullish, Bullish Turned
 Shareholding Snapshot : Mar 2026
Shareholding Compare (%holding)
Non Institution
None
Held by 0 Schemes
Held by 0 FIIs
Tyro Commercial Private Limited (3.2%)
Sushanta Naskar (2.07%)
82.25%
Quarterly Results Snapshot (Standalone) - Mar'26 - QoQ

QoQ Growth in quarter ended Mar 2026 is 822.22% vs -60.87% in Dec 2025
QoQ Growth in quarter ended Mar 2026 is 0.00% vs -83.33% in Dec 2025
Half Yearly Results Snapshot (Standalone) - Sep'25
Growth in half year ended Sep 2025 is -34.91% vs -59.07% in Sep 2024

Growth in half year ended Sep 2025 is -60.61% vs 37.50% in Sep 2024
Nine Monthly Results Snapshot (Standalone) - Dec'25
YoY Growth in nine months ended Dec 2025 is -48.34% vs -45.49% in Dec 2024
YoY Growth in nine months ended Dec 2025 is -71.43% vs 113.04% in Dec 2024
Annual Results Snapshot (Standalone) - Mar'26
YoY Growth in year ended Mar 2026 is -42.03% vs -29.23% in Mar 2025
YoY Growth in year ended Mar 2026 is -21.05% vs -9.52% in Mar 2025
About Symbiox Investment & Trading Co Ltd

Company Coordinates


