
 Price Point
Compare Syncom Formul. with Similar Stocks
ScoreDashboard
Company has a Debt to Equity ratio (avg) of 0.02 times
Poor long term growth as Net Sales has grown by an annual rate of -53.39% and Operating profit at -42.14% over the last 5 years
Positive results in Jan 70
With ROE of 18.4, it has a Expensive valuation with a 4.5 Price to Book Value
Despite the size of the company, domestic mutual funds hold only 0% of the company
Market Beating performance in long term as well as near term
Mojo ParametersStock DNA

Pharmaceuticals & Biotechnology

INR 2,075 Cr (Micro Cap)

22.00
27

0.50%

-0.27

18.41%

4.54
Total ReturnsTotal Returns (Price + Dividend) 
Latest dividend: 0.10015 per share ex-dividend date: Sep-23-2026
Risk Adjusted Returns v/s
Returns Beta
 News & Corporate Actions
News
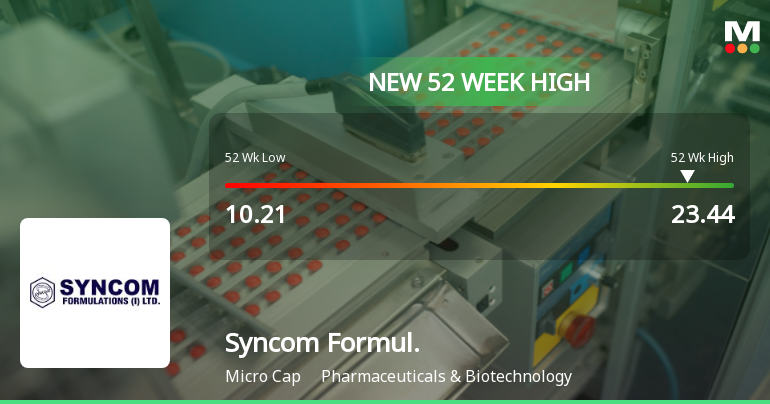
Broad-Based Technical Strength Lifts Syncom Formulations (India) Ltd to 52-Week High of Rs 23.44
With a decisive surge to Rs 23.44 on 28 Sep 2026, Syncom Formulations (India) Ltd has reached a fresh 52-week high, marking a 130% rally from its low of Rs 10.21 over the past year. This milestone comes amid a backdrop of broad technical alignment and sustained price momentum, even as the broader Sensex index trades near its own 52-week lows.
Read full news article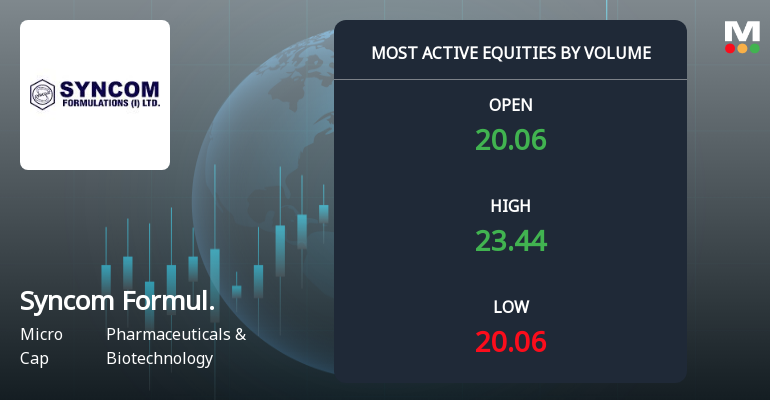
Syncom Formulations Surges on Exceptional Volume Amid Positive Momentum
Syncom Formulations (India) Ltd witnessed a remarkable surge in trading volume and price on 28 Sep 2026, emerging as one of the most actively traded stocks in the Pharmaceuticals & Biotechnology sector. The micro-cap company’s shares rallied by over 9%, supported by robust volume and technical strength, signalling renewed investor interest and potential accumulation.
Read full news article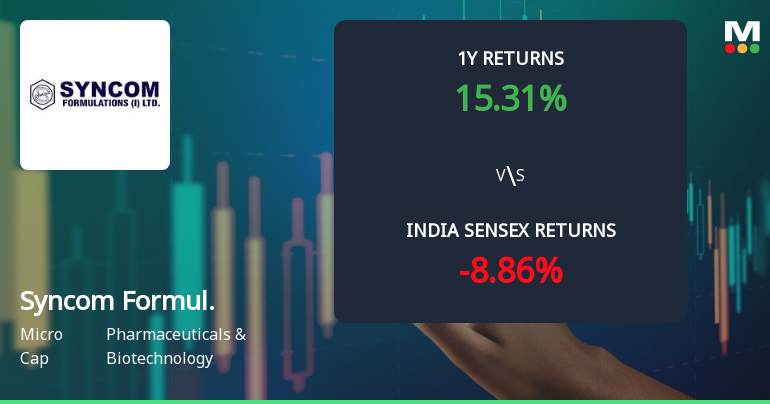
Syncom Formulations (India) Ltd: Technical Momentum Shifts Amid Mixed Indicator Signals
Syncom Formulations (India) Ltd has experienced a nuanced shift in its technical momentum, transitioning from a bullish to a mildly bullish trend as of late September 2026. Despite a recent day decline of 1.81%, the stock’s technical indicators present a complex picture, with bullish signals from MACD and moving averages contrasting with bearish RSI readings and mixed monthly trends. This article analyses these technical parameters in detail, contextualising the stock’s performance against broader market benchmarks and its own historical returns.
Read full news article Announcements
Closure of Trading Window
24-Sep-2026 | Source : BSEWe would like to inform you that Pursuant to the provisions of SEBI (PIT) Regulation 2015. The window for dealing in the securities of the company shall remain closed from 1st Oct 2026 and shall remain closed until 48 hours after the declaration of Unaudited Standalone & Consolidated Financial Results of the company for the quarter and half year ended on 30th September 2026.
Corporate Announcement/Information Under Regulation 42 Of SEBI (LODR) Regulations 2015 Regarding Record Date.
18-Sep-2026 | Source : BSEWe are pleased to inform you that pursuant to the provision of regulation 42 of SEBI (LODR) regulation 2015 and section 91 of companies Act 2013 the "Record Date" has been fixed as Wednesday 23rd September 2026 for the purpose of determining the entitlement of members for the payment of dividend.
Announcement under Regulation 30 (LODR)-Newspaper Publication
08-Sep-2026 | Source : BSESubmission of copy of newpaper clippings of notice of 38th Annual General Meeting (AGM) Remote E-Voting Record Date and other details.
Corporate Actions

No Upcoming Board Meetings

Syncom Formulations (India) Ltd has declared 10% dividend, ex-date: 23 Sep 26

Syncom Formulations (India) Ltd has announced 1:10 stock split, ex-date: 19 Aug 13

Syncom Formulations (India) Ltd has announced 5:2 bonus issue, ex-date: 19 Aug 13

Syncom Formulations (India) Ltd has announced 1:2 rights issue, ex-date: 13 May 09
Key FactorsQuality key factors
Valuation key factors
Technicals key factors
 Technical Indicator Scale: Bearish, Mildly Bearish, Sideways, Mildly Bullish, Bullish Turned Shareholding
Shareholding Snapshot : Jun 2026
Shareholding Compare (%holding)
Promoters
None
Held by 2 Schemes (0.0%)
Held by 15 FIIs (0.35%)
Kedarmal Shankarlal Bankda (12.44%)
None
44.9%
FinancialQuarterly Results Snapshot (Consolidated) - Jun'26 - QoQ
 Compare with Peers
QoQ Growth in quarter ended Jun 2026 is -7.30% vs 17.60% in Mar 2026
QoQ Growth in quarter ended Jun 2026 is -1.27% vs 33.10% in Mar 2026

Half Yearly Results Snapshot (Consolidated) - Sep'25
Growth in half year ended Sep 2025 is 26.52% vs 52.50% in Sep 2024

Growth in half year ended Sep 2025 is 72.59% vs 71.86% in Sep 2024
Nine Monthly Results Snapshot (Consolidated) - Dec'25
YoY Growth in nine months ended Dec 2025 is 11.90% vs 67.43% in Dec 2024
YoY Growth in nine months ended Dec 2025 is 61.48% vs 77.28% in Dec 2024
Annual Results Snapshot (Consolidated) - Mar'26
YoY Growth in year ended Mar 2026 is 5.20% vs 76.55% in Mar 2025
YoY Growth in year ended Mar 2026 is 54.64% vs 95.30% in Mar 2025
 Company CV
About Syncom Formulations (India) Ltd










