
Compare Syncom Formul. with Similar Stocks
Stock DNA
Pharmaceuticals & Biotechnology
INR 1,342 Cr (Micro Cap)
18.00
34
0.00%
-0.27
18.41%
3.14
Total Returns (Price + Dividend) 
Latest dividend: 0.03 per share ex-dividend date: Sep-09-2022
Risk Adjusted Returns v/s
Returns Beta

News
Syncom Formulations (India) Ltd is Rated Sell
Syncom Formulations (India) Ltd is rated 'Sell' by MarketsMOJO, with this rating last updated on 12 February 2026. However, the analysis and financial metrics discussed here reflect the company’s current position as of 11 June 2026, providing investors with an up-to-date view of the stock’s fundamentals, returns, and technical outlook.
Read full news article
Syncom Formulations (India) Ltd is Rated Sell
Syncom Formulations (India) Ltd is rated Sell by MarketsMOJO. This rating was last updated on 12 Feb 2026. However, the analysis and financial metrics discussed here reflect the stock’s current position as of 31 May 2026, providing investors with the latest insights into the company’s performance and outlook.
Read full news article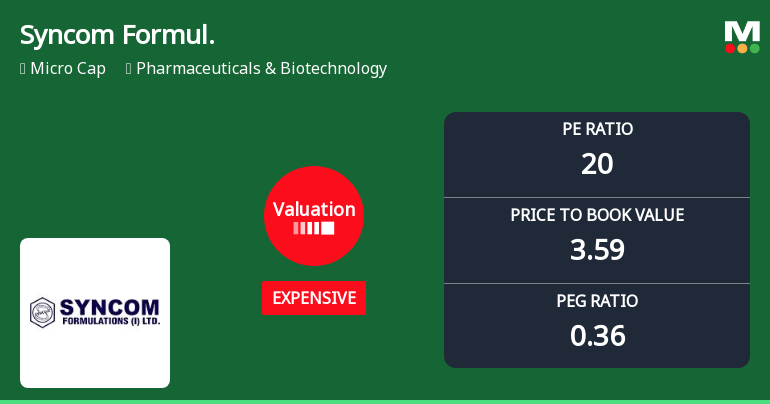
Syncom Formulations Valuation Shifts Signal Growing Price Pressure Amid Sector Dynamics
Syncom Formulations (India) Ltd has seen a notable shift in its valuation parameters, moving from fair to expensive territory, as reflected in its price-to-earnings (P/E) and price-to-book value (P/BV) ratios. Despite a strong recent price rally, the company’s valuation now demands closer scrutiny against its historical averages and peer group benchmarks within the Pharmaceuticals & Biotechnology sector.
Read full news article Announcements
Announcement under Regulation 30 (LODR)-Newspaper Publication
23-May-2026 | Source : BSESubmission of Press Clipping related to extract of Audited Financial Results for the year ended 31.03.2026
Board Meeting Outcome for Regulation 33(3)(D) Of SEBI (LODR) Regulations 2015-Submission Of Standalone & Consolidated Audited Financial Results Along With Audit Report Statement Of Assets And Liabilities And Cash Flow For The Year Ended On 31St March 2026
22-May-2026 | Source : BSEPursuant to Regulation 33(3)(d) of SEBI (LODR) Regulations 2015 we are pleased to submit the Standalone & Consolidated Audited Financial Results along with Auditors Report thereon by Statutory Auditors Statement of Assets and Liabilities and Cash Flow for the quarter/year ended on 31st March 2026 in PDF Format which were approved by the Audit Committee and Board of Directors at their meeting held on Friday 22nd May 2026.
Regulation 33(3)(D) Of SEBI (LODR) Regulations 2015-Submission Of Standalone & Consolidated Audited Financial Results Along With Audit Report Statement Of Assets And Liabilities And Cash Flow For The Year Ended On 31St March 2026.
22-May-2026 | Source : BSEPursuant to regulation 33(3)(d) of SEBI LODR Regulations 2015 we are pleased to submit the financials for the year ended on 31st March 2026
Corporate Actions

No Upcoming Board Meetings

Syncom Formulations (India) Ltd has declared 3% dividend, ex-date: 09 Sep 22

Syncom Formulations (India) Ltd has announced 1:10 stock split, ex-date: 19 Aug 13

Syncom Formulations (India) Ltd has announced 5:2 bonus issue, ex-date: 19 Aug 13

Syncom Formulations (India) Ltd has announced 1:2 rights issue, ex-date: 13 May 09
Quality key factors
Valuation key factors
Technicals key factors
 Technical Indicator Scale: Bearish, Mildly Bearish, Sideways, Mildly Bullish, Bullish Turned
 Shareholding Snapshot : Mar 2026
Shareholding Compare (%holding)
Promoters
None
Held by 2 Schemes (0.0%)
Held by 11 FIIs (0.21%)
Kedarmal Shankarlal Bankda (12.44%)
None
45.15%
Quarterly Results Snapshot (Consolidated) - Mar'26 - QoQ

QoQ Growth in quarter ended Mar 2026 is 17.60% vs -5.41% in Dec 2025
QoQ Growth in quarter ended Mar 2026 is 33.10% vs 13.92% in Dec 2025
Half Yearly Results Snapshot (Consolidated) - Sep'25

Growth in half year ended Sep 2025 is 26.52% vs 52.50% in Sep 2024
Growth in half year ended Sep 2025 is 72.59% vs 71.86% in Sep 2024
Nine Monthly Results Snapshot (Consolidated) - Dec'25
YoY Growth in nine months ended Dec 2025 is 11.90% vs 67.43% in Dec 2024
YoY Growth in nine months ended Dec 2025 is 61.48% vs 77.28% in Dec 2024
Annual Results Snapshot (Consolidated) - Mar'26
YoY Growth in year ended Mar 2026 is 5.20% vs 76.55% in Mar 2025
YoY Growth in year ended Mar 2026 is 54.64% vs 95.30% in Mar 2025
About Syncom Formulations (India) Ltd

Company Coordinates


