
Compare Syndax Pharmaceuticals, Inc. with Similar Stocks
Dashboard
Poor Management Efficiency with a low ROE of 0.83%
- The company has been able to generate a Return on Equity (avg) of 0.83% signifying low profitability per unit of shareholders funds
The company has declared Negative results for the last 11 consecutive quarters
Risky - Negative EBITDA
Market Beating Performance
Stock DNA
Pharmaceuticals & Biotechnology
USD 1,783 Million (Small Cap)
NA (Loss Making)
NA
0.00%
-0.79
-269.93%
15.45
Total Returns (Price + Dividend) 
Syndax Pharmaceuticals, Inc. for the last several years.
Risk Adjusted Returns v/s
News
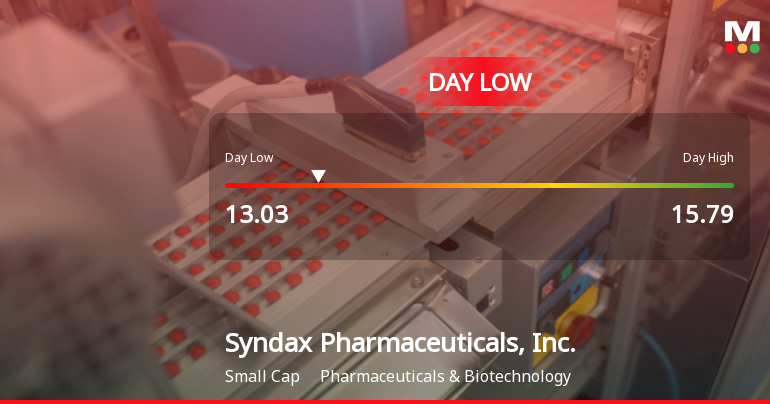
Syndax Pharmaceuticals Hits Day Low at $13.03 Amid Price Pressure
Syndax Pharmaceuticals, Inc. faced a notable decline in stock performance, reflecting ongoing challenges and negative results over 11 consecutive quarters. The company's one-year performance shows a significant drop, contrasting with broader market gains. Despite slight promoter confidence, Syndax's market position remains precarious within the pharmaceuticals sector.
Read full news article
Syndax Pharmaceuticals Experiences Revision in Stock Evaluation Amid Market Dynamics
Syndax Pharmaceuticals, Inc. has experienced significant stock fluctuations, currently priced at $13.53, down from a 52-week high of $22.50. The company has underperformed compared to the S&P 500 over the past year and three years, indicating ongoing challenges in the biotechnology sector.
Read full news article Announcements

Corporate Actions
Quality key factors
Valuation key factors
Technicals key factors
 Technical Indicator Scale: Bearish, Mildly Bearish, Sideways, Mildly Bullish, Bullish Turned
 Shareholding Snapshot : Sep 2025
Shareholding Compare (%holding)
Domestic Funds
Held in 60 Schemes (31.2%)
Held by 111 Foreign Institutions (19.48%)
Quarterly Results Snapshot (Consolidated) - Sep'25 - YoY

YoY Growth in quarter ended Sep 2025 is 267.20% vs 0.00% in Sep 2024
YoY Growth in quarter ended Sep 2025 is 27.82% vs -64.58% in Sep 2024
Annual Results Snapshot (Consolidated) - Dec'24
YoY Growth in year ended Dec 2024 is 0.00% vs 0.00% in Dec 2023

YoY Growth in year ended Dec 2024 is -52.24% vs -40.25% in Dec 2023
About Syndax Pharmaceuticals, Inc.

Company Coordinates


