
Compare Synergy Green with Similar Stocks
Dashboard
High Debt company with Weak Long Term Fundamental Strength
- Poor long term growth as Net Sales has grown by an annual rate of 12.98% and Operating profit at 3.74% over the last 5 years
- Company's ability to service its debt is weak with a poor EBIT to Interest (avg) ratio of 1.53
With a fall in Operating Profit of -4.73%, the company declared Very Negative results in Mar 26
Stock DNA
Castings & Forgings
INR 923 Cr (Micro Cap)
173.00
50
0.15%
2.15
4.78%
9.07
Total Returns (Price + Dividend) 
Latest dividend: 1 per share ex-dividend date: Sep-17-2025
Risk Adjusted Returns v/s
Returns Beta

News
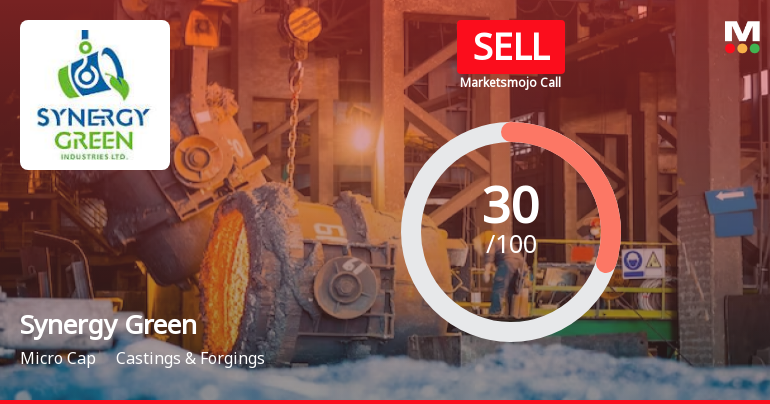
Synergy Green Industries Ltd is Rated Sell
Synergy Green Industries Ltd is rated 'Sell' by MarketsMOJO, with this rating last updated on 08 June 2026. However, the analysis and financial metrics presented here reflect the stock's current position as of 17 July 2026, providing investors with an up-to-date view of the company’s fundamentals, returns, and technical outlook.
Read full news article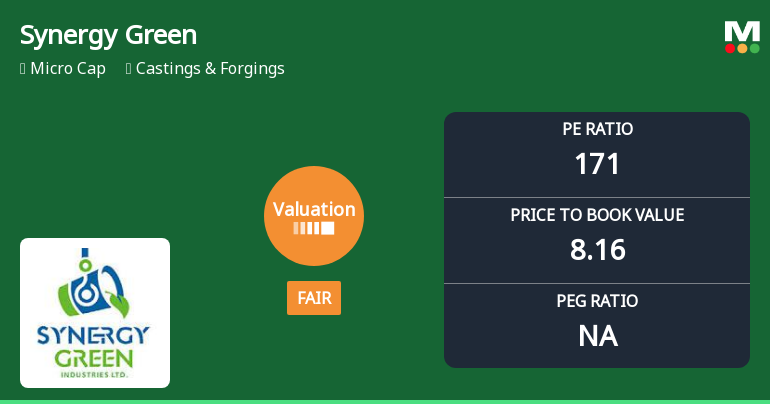
Synergy Green Industries Ltd Valuation Shifts Amidst Market Rally
Synergy Green Industries Ltd has witnessed a notable shift in its valuation parameters, moving from an attractive to a fair valuation grade, reflecting evolving market perceptions within the Castings & Forgings sector. Despite a strong year-to-date return of 14.1%, the company’s elevated price-to-earnings (P/E) and price-to-book value (P/BV) ratios suggest a recalibration of investor expectations amid sector peers’ varied valuations.
Read full news article
Synergy Green Industries Ltd is Rated Sell
Synergy Green Industries Ltd is rated 'Sell' by MarketsMOJO, with this rating last updated on 08 June 2026. However, the analysis and financial metrics discussed here reflect the stock's current position as of 06 July 2026, providing investors with the most up-to-date view of the company’s fundamentals, returns, and market standing.
Read full news article Announcements
Compliances-Certificate under Reg. 74 (5) of SEBI (DP) Regulations 2018
16-Jul-2026 | Source : BSESubmission of certificate under reg. 74(5) of SEBI (DP) Regulations 2018.
Reg. 34 (1) Annual Report.
03-Jul-2026 | Source : BSESubmission of Corrected 16th Annual report of the Company.
Corrigendum To The Notice Of 16Th Annual General Meeting Of The Company To Be Held On Thursday July 23 2026
03-Jul-2026 | Source : BSECorrigendum to the Notice of 16th Annual General Meeting of the Company due to typographical errors in the report.
Corporate Actions

No Upcoming Board Meetings

Synergy Green Industries Ltd has declared 10% dividend, ex-date: 17 Sep 25

No Splits history available

No Bonus history available

Synergy Green Industries Ltd has announced 1:10 rights issue, ex-date: 11 Sep 24
Quality key factors
Valuation key factors
Technicals key factors
 Technical Indicator Scale: Bearish, Mildly Bearish, Sideways, Mildly Bullish, Bullish Turned
 Shareholding Snapshot : Mar 2026
Shareholding Compare (%holding)
Promoters
None
Held by 0 Schemes
Held by 3 FIIs (0.22%)
S B Reshellers Private Limited (34.81%)
Aniruddha Narayan Malpani (1.89%)
23.47%
Quarterly Results Snapshot (Standalone) - Mar'26 - QoQ

QoQ Growth in quarter ended Mar 2026 is 29.64% vs 27.53% in Dec 2025
QoQ Growth in quarter ended Mar 2026 is 127.52% vs -163.14% in Dec 2025
Half Yearly Results Snapshot (Standalone) - Sep'25

Growth in half year ended Sep 2025 is -7.23% vs 7.64% in Sep 2024
Growth in half year ended Sep 2025 is -19.27% vs 24.96% in Sep 2024
Nine Monthly Results Snapshot (Standalone) - Dec'25
YoY Growth in nine months ended Dec 2025 is -6.58% vs 8.52% in Dec 2024
YoY Growth in nine months ended Dec 2025 is -67.46% vs 57.35% in Dec 2024
Annual Results Snapshot (Standalone) - Mar'26
YoY Growth in year ended Mar 2026 is 1.15% vs 11.02% in Mar 2025
YoY Growth in year ended Mar 2026 is -72.41% vs 46.11% in Mar 2025
About Synergy Green Industries Ltd

Company Coordinates


