Synergy Green

  • Market Cap: Micro Cap
  • Industry: Castings & Forgings
  • ISIN: INE00QT01015
  • NSEID: SGIL
  • BSEID: 541929
INR
546.05
-4.85 (-0.88%)
BSENSE

Dec 04

BSE+NSE Vol: 6.38 k

  • Price Points
  • Score
  • Mojo Parameters
  • Total Return
  • News and Corporate Actions
  • Key factors
  • Shareholding
  • Financials
  • CompanyCV
stock-summaryPrice Point
High/Low

1Day

52 Week

Valuation
Technical
Day's Volume

CASH

6.38 k (-35.57%) Volume

Shareholding (Sep 2025)

FII

0.42%

Held by 6 FIIs

DII

0.00%

Held by 0 DIIs

Promoter

69.39%

Who are in the management team of Synergy Green?

06-Jun-2025

As of March 2023, the management team of Synergy Green includes Chairman & Managing Director Sachin Rajendra Shirgaokar, Joint Managing Director Sohan Sanjeev Shirgaokar, and several directors, including independent directors, overseeing the company's strategic direction and management.

As of March 2023, the management team of Synergy Green includes the following individuals:<BR><BR>1. Sachin Rajendra Shirgaokar - Chairman & Managing Director<BR>2. Sohan Sanjeev Shirgaokar - Joint Managing Director<BR>3. Vendavagali Srinivasa Reddy - Director (Technical)<BR>4. Shishir Suresh Shirgaokar - Director<BR>5. Chandan Sanjeev Shirgaokar - Director<BR>6. Prabha Prakash Kulkarni - Independent Director<BR>7. Mallappa Rachappa Desai - Independent Director<BR>8. Dattaram Pandurang Kamat - Independent Director<BR>9. Meyyappan Shanmugam - Independent Director<BR>10. Nilesh Mohan Mankar - Company Secretary & Compliance Officer<BR>11. Subhash Gundappa Kutte - Independent Director<BR><BR>This team is responsible for the strategic direction and management of the company.

Read More

When is the next results date for Synergy Green?

06-Jun-2025

No Upcoming Board Meetings

Has Synergy Green declared dividend?

06-Jun-2025

No Dividend History Available

Who are the peers of the Synergy Green?

16-Jul-2025

Synergy Green's peers include Happy Forgings, Balu Forge, Steelcast, Amic Forging, Nelcast, Magna Electrocas, Inv.& Prec.Cast., Nitin Castings, Kalyani Forge, and Tirupati Forge. In terms of performance, Synergy Green has an average management risk, a 1-year return of 55.63%, and a below-average capital structure compared to its peers.

Peers: The peers of Synergy Green are Happy Forgings, Balu Forge, Steelcast, Amic Forging, Nelcast, Magna Electrocas, Inv.& Prec.Cast., Nitin Castings, Kalyani Forge, and Tirupati Forge.<BR><BR>Quality Snapshot: Excellent management risk is observed at Balu Forge, Steelcast, and Magna Electrocas, while Average management risk is found at Happy Forgings, Amic Forging, Nelcast, Synergy Green, Inv.& Prec.Cast., Nitin Castings, Kalyani Forge, and Tirupati Forge. For Growth, Excellent growth is noted at Balu Forge and Tirupati Forge, Good growth is seen at Amic Forging and Nitin Castings, while Average growth is found at Happy Forgings, Steelcast, Synergy Green, Magna Electrocas, Kalyani Forge, and the rest. In terms of Capital Structure, Excellent capital structure is present at Balu Forge, Steelcast, Nitin Castings, and Magna Electrocas, while Good capital structure is noted at Amic Forging and Tirupati Forge, and Below Average capital structure is observed at Nelcast, Synergy Green, Inv.& Prec.Cast., and Kalyani Forge.<BR><BR>Return Snapshot: The peer with the highest 1-year return is Magna Electrocas at 175.23%, while the peer with the lowest is Happy Forgings at -24.34%. Synergy Green's 1-year return of 55.63% is significantly higher than that of Happy Forgings but lower than that of Magna Electrocas. Additionally, Nelcast and Nitin Castings are the peers whose six-month return is negative.

Read More

What does Synergy Green do?

17-Jul-2025

Synergy Green Industries Ltd manufactures castings for industrial applications, including turbine and windmill parts. As of March 2025, it reported net sales of 975 Cr and a net profit of 38 Cr, with a market cap of INR 853 Cr.

Overview:<BR>Synergy Green Industries Ltd is engaged in the manufacturing of castings, including industrial, turbine, metal, steel castings, and windmill parts, operating within the Castings & Forgings industry and classified as a Micro Cap company.<BR><BR>History:<BR>The company was originally incorporated as a Private Limited Company on October 08, 2010, and later converted into a Public Limited Company on February 16, 2018. The latest quarterly results reported net sales and net profit for the period ending March 2025.<BR><BR>Financial Snapshot:<BR>- Net Sales: 975 Cr (Quarterly Results - Mar 2025)<BR>- Net Profit: 38 Cr (Quarterly Results - Mar 2025)<BR>- Market Cap: INR 853 Cr (Micro Cap)<BR><BR>Key Metrics:<BR>- P/E: 50.00<BR>- Industry P/E: 32<BR>- Dividend Yield: 0.00%<BR>- Debt-Equity: 0.94<BR>- Return on Equity: 15.70%<BR>- Price to Book: 7.80<BR><BR>Contact Details:<BR>Address: 392 E Ward Assembly road, Shahupuri Kolhapur Maharashtra : 416001<BR>Tel: 91-0231-2658375<BR>Email: info@synergygreenind.com<BR>Website: http://www.synergygreenind.com

Read More

Who are the top shareholders of the Synergy Green?

17-Jul-2025

The top shareholders of Synergy Green include S B Reshellers Private Limited with 34.81%, individual investors holding 24.91%, and four foreign institutional investors with a combined 0.21%. There are no mutual funds or pledged promoter holdings.

The top shareholders of Synergy Green include the promoters, who are the majority shareholders. The promoter with the highest holding is S B Reshellers Private Limited, which owns 34.81% of the shares. Individual investors hold a significant portion as well, with their holdings at 24.91%. Additionally, there are four foreign institutional investors (FIIs) that collectively hold 0.21% of the company. There are no mutual funds currently holding shares in Synergy Green, and there are no pledged promoter holdings.

Read More

How big is Synergy Green?

24-Jul-2025

As of 24th July, Synergy Green Industries Ltd has a market capitalization of 892.00 Cr and reported net sales of 362.26 Cr and a net profit of 16.90 Cr over the latest four quarters.

As of 24th July, <BR><BR>Market Cap: Synergy Green Industries Ltd has a market capitalization of 892.00 Cr, classified as a Micro Cap.<BR><BR>Recent Quarterly Performance: The sum of Net Sales for the latest 4 quarters is 362.26 Cr, while the sum of Net Profit for the same period is 16.90 Cr.<BR><BR>Balance Sheet Snapshot: The reporting period for the latest annual data is March 2024. Shareholder's Funds are valued at 46.69 Cr, and Total Assets amount to 198.00 Cr.

Read More

Are Synergy Green latest results good or bad?

08-Aug-2025

Synergy Green's latest results show mixed performance: while Profit After Tax grew by 49.49% to Rs 13.17 crore and the debt-equity ratio improved, net sales declined by 7.7% and profit before tax fell to Rs 3.31 crore, indicating more challenges than positives overall.

The latest results for Synergy Green Industries indicate a mixed performance. On the positive side, the Profit After Tax (PAT) for the nine-month period shows a significant year-on-year growth of 49.49%, reaching Rs 13.17 crore. Additionally, the company's debt-equity ratio has improved to 1.45 times, the lowest in recent periods, suggesting better management of its debt relative to equity.<BR><BR>However, there are notable challenges as well. The company experienced a decline in net sales by 7.7% for the quarter, totaling Rs 83.56 crore, and the profit before tax (PBT) decreased to Rs 3.31 crore, indicating a negative trend. The operating profit to interest ratio has also dropped to 2.44 times, the lowest in five quarters, which raises concerns about the company's ability to manage its interest payments effectively. Furthermore, the reliance on non-operating income, which makes up a significant portion of PBT, could pose sustainability issues.<BR><BR>Overall, while there are some positive indicators, the decline in sales and profit margins suggests that the latest results are more challenging than favorable.

Read More

Is Synergy Green overvalued or undervalued?

11-Sep-2025

As of September 10, 2025, Synergy Green's valuation has improved to attractive, being assessed as undervalued with a PE ratio of 51.39 and strong performance metrics, including a 29.18% stock return over the past year, significantly outperforming the Sensex.

As of 10 September 2025, the valuation grade for Synergy Green has moved from fair to attractive, indicating a positive shift in its perceived value. The company is currently assessed as undervalued, supported by a PE ratio of 51.39, an EV to EBITDA of 18.63, and a PEG ratio of 1.65. In comparison to its peers, Bharat Forge has a higher PE ratio of 55.93 and an EV to EBITDA of 23.39, while CIE Automotive is noted for its very attractive valuation with a significantly lower PE of 19.39 and an EV to EBITDA of 11.45.<BR><BR>Additionally, Synergy Green has demonstrated strong performance with a ROCE of 18.79% and a ROE of 16.10%, which further reinforces its attractive valuation. Notably, the company's stock has outperformed the Sensex significantly over the past year, with a return of 29.18% compared to the Sensex's decline of 0.61%, highlighting its strong market position and growth potential.

Read More

Is Synergy Green technically bullish or bearish?

29-Sep-2025

As of September 26, 2025, the trend is mildly bullish due to supportive monthly indicators, though short-term weekly signals show some weakness, suggesting a cautious bullish outlook overall.

As of 26 September 2025, the technical trend has changed from bullish to mildly bullish. The current stance is mildly bullish, supported by a bullish monthly MACD and RSI, along with bullish Bollinger Bands and moving averages on the daily timeframe. However, the weekly MACD and KST are mildly bearish, indicating some short-term weakness. The Dow Theory shows a mildly bearish signal on the weekly but remains bullish on the monthly. Overall, the mixed signals suggest a cautious bullish outlook with underlying strength in the longer-term indicators.

Read More

How has been the historical performance of Synergy Green?

13-Nov-2025

Synergy Green has shown consistent growth, with net sales increasing from 289.71 Cr in March 2023 to 362.27 Cr in March 2025, and operating profit rising from 26.06 Cr to 52.29 Cr in the same period, indicating significant improvements in profitability and operational efficiency. Total assets also grew to 341.90 Cr, reflecting the company's robust financial performance.

Answer:<BR>The historical performance of Synergy Green shows a consistent growth trajectory in net sales and profitability over the years, culminating in significant improvements by March 2025.<BR><BR>Breakdown:<BR>Synergy Green's net sales have increased from 289.71 Cr in March 2023 to 362.27 Cr in March 2025, reflecting a strong upward trend. Total operating income followed suit, rising to 362.27 Cr in March 2025 from 289.71 Cr in March 2023. The company's total expenditure also grew, reaching 309.98 Cr in March 2025, up from 263.65 Cr in March 2023. Operating profit, excluding other income, showed a notable increase from 26.06 Cr in March 2023 to 52.29 Cr in March 2025, contributing to an operating profit margin of 14.43% in March 2025. Profit before tax surged to 24.99 Cr in March 2025 from just 0.69 Cr in March 2023, while profit after tax rose to 16.89 Cr from 0.87 Cr in the same period, indicating a significant improvement in profitability. The company's total assets increased to 341.90 Cr in March 2025 from 181.77 Cr in March 2023, with total liabilities also rising to 155.93 Cr. Cash flow from operating activities improved to 37.00 Cr in March 2024, up from 25.00 Cr in March 2023, showcasing enhanced operational efficiency. Overall, Synergy Green's financial performance demonstrates robust growth and improved profitability over the analyzed period.

Read More

Should I buy, sell or hold Synergy Green?

15-Nov-2025

Why is Synergy Green falling/rising?

05-Dec-2025

As of 04-Dec, Synergy Green Industries Ltd's stock price is at 546.05, reflecting a decline of 0.88% and a negative return of 1.10% over the past week. Recent trading activity has decreased significantly, indicating weakening momentum despite strong long-term performance.

As of 04-Dec, Synergy Green Industries Ltd's stock price is falling, currently at 546.05, which reflects a decrease of 4.85 or 0.88%. This decline is part of a broader trend, as the stock has been losing value for the last three days, resulting in a total drop of 1.57% during this period. <BR><BR>In terms of performance relative to the benchmark, the stock has shown a negative return of 1.10% over the past week, while the Sensex has only decreased by 0.53%. Although the stock has performed well over longer periods, with a year-to-date increase of 16.18% and a remarkable 291.29% rise over the past three years, the recent short-term performance indicates a downturn.<BR><BR>Additionally, there has been a notable decline in investor participation, with the delivery volume on December 3rd falling by 28.93% compared to the five-day average. This decrease in trading activity may contribute to the downward pressure on the stock price. Despite being above the 50-day, 100-day, and 200-day moving averages, the stock is currently below the 5-day and 20-day moving averages, suggesting a weakening momentum in the short term.

Read More
iScoreScore
Click here to find our call on this stock
Strong Sell
Sell
Hold
Buy
Strong Buy

MarketsMojo — Loved in India, Now Global

The power of Mojo is now in 29 countries. Explore global equities with the same cutting-edge features you love.

Dashboard
1

Company's ability to service its debt is weak with a poor EBIT to Interest (avg) ratio of 1.68

  • Company's ability to service its debt is weak with a poor EBIT to Interest (avg) ratio of 1.68
2

With a fall in Operating Profit of -11.03%, the company declared Very Negative results in Sep 25

3

Despite the size of the company, domestic mutual funds hold only 0% of the company

stock-summaryMojo Parameters
Mojo Parameters
Loading Valuation Snapshot...
Stock DNA
stock-summary
Industry

Castings & Forgings

stock-summary
Market cap

INR 854 Cr (Micro Cap)

stock-summary
P/E

55.00

stock-summary
Industry P/E

35

stock-summary
Dividend Yield

0.18%

stock-summary
Debt Equity

1.30

stock-summary
Return on Equity

13.89%

stock-summary
Price to Book

7.77

Revenue and Profits:
Net Sales:
72 Cr
(Quarterly Results - Sep 2025)
Net Profit:
2 Cr
stock-summaryTotal Returns
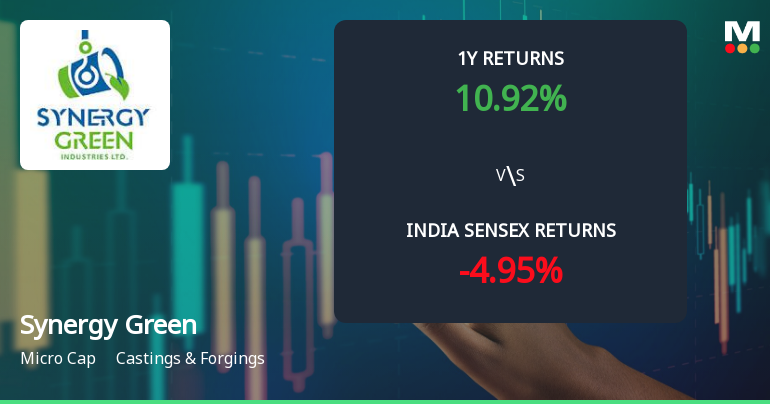
Total Returns (Price + Dividend) stock-summary
Dividend Yield (0.18%)
TimePeriod
Price Return
Dividend Return
Total Return
3 Months
1.18%
0.17%
1.35%
6 Months
4.41%
0.19%
4.6%
1 Year
17.81%
0.21%
18.02%
2 Years
86.62%
0.30%
86.92%
3 Years
291.29%
0.76%
292.05%
4 Years
245.27%
0.62%
245.89%
5 Years
508.41%
1.11%
509.52%

Latest dividend: 1 per share ex-dividend date: Sep-17-2025

Risk Adjusted Returns v/s stock-summary
Returns Beta
Icon
Beta has not been calculated since enough price history is not available
stock-summaryNews & Corporate Actions
News
Announcements stock-summary

Announcement under Regulation 30 (LODR)-Analyst / Investor Meet - Intimation

20-Nov-2025 | Source : BSE

We would like to inform you that the Company will be interacting with group of Analysts/Investors (Participants) in the plant visit and management meet organized by our investor relations firm Kairovest Advisors.

Announcement under Regulation 30 (LODR)-Analyst / Investor Meet - Outcome

15-Nov-2025 | Source : BSE

Submission of Transcript of Investors earning Call held on 13.11.2025 of Synergy Green Industries Limited.

Announcement under Regulation 30 (LODR)-Newspaper Publication

14-Nov-2025 | Source : BSE

Submission of Newspaper advertisement for Unaudited Results for the quarter ended 30.09.2025

Corporate Actions stock-summary
stock-summary
BOARD MEETING

No Upcoming Board Meetings

stock-summary
DIVIDEND

Synergy Green Industries Ltd has declared 10% dividend, ex-date: 17 Sep 25

stock-summary
SPLITS

No Splits history available

stock-summary
BONUS

No Bonus history available

stock-summary
RIGHTS

Synergy Green Industries Ltd has announced 1:10 rights issue, ex-date: 11 Sep 24

stock-summaryKey Factors
Quality key factors stock-summary
Factor
Value
Sales Growth (5y)
22.93%
EBIT Growth (5y)
106.32%
EBIT to Interest (avg)
1.68
Debt to EBITDA (avg)
2.82
Net Debt to Equity (avg)
1.30
Sales to Capital Employed (avg)
2.26
Tax Ratio
33.00%
Dividend Payout Ratio
9.20%
Pledged Shares
0
Institutional Holding
0.42%
ROCE (avg)
17.23%
ROE (avg)
15.17%
Valuation key factors
Factor
Value
P/E Ratio
55
Industry P/E
35
Price to Book Value
7.59
EV to EBIT
27.87
EV to EBITDA
20.10
EV to Capital Employed
3.86
EV to Sales
2.84
PEG Ratio
2.77
Dividend Yield
0.18%
ROCE (Latest)
13.87%
ROE (Latest)
13.89%
Technicals key factors
Indicator
Weekly
Monthly
MACD
Mildly Bearish
Bullish
RSI
No Signal
No Signal
Bollinger Bands
Sideways
Mildly Bullish
Moving Averages
Bullish (Daily)
KST
Mildly Bearish
Mildly Bearish
Dow Theory
No Trend
No Trend
OBV
Mildly Bullish
No Trend
stock-summary Technical Indicator Scale: Bearish, Mildly Bearish, Sideways, Mildly Bullish, Bullish  Turned 
stock-summaryShareholding
Shareholding Snapshot : Sep 2025stock-summary
Shareholding Compare (%holding) stock-summary
Majority shareholders

Promoters

Pledged Promoter Holdings

None

Mutual Funds

Held by 0 Schemes

FIIs

Held by 6 FIIs (0.42%)

Promoter with highest holding

S B Reshellers Private Limited (34.81%)

Highest Public shareholder

Capri Global Holdings Private Limited (1.95%)

Individual Investors Holdings

23.16%

stock-summaryFinancial
[
  {
    "link": "quarterly",
    "btn_text": "All Quarterly Results",
    "header": "Quarterly Results Snapshot (Standalone) - Sep'25 - QoQ",
    "rhs": [
      {
        "prefix": "Net Sales ",
        "suffix": "QoQ Growth in quarter ended Sep 2025 is -13.83% vs -14.27% in Jun 2025",
        "dir": 1
      },
      {
        "prefix": "Standalone Net Profit ",
        "suffix": "QoQ Growth in quarter ended Sep 2025 is -30.18% vs -11.98% in Jun 2025",
        "dir": -1
      }
    ],
    "table": {
      "header": [
        "Sep'25",
        "Jun'25",
        "Change(%)"
      ],
      "body": [
        {
          "field": "Net Sales",
          "val1": "72.00",
          "val2": "83.56",
          "chgp": "-13.83%",
          "chgp_class": "negative"
        },
        {
          "field": "Operating Profit (PBDIT) excl Other Income",
          "val1": "9.32",
          "val2": "11.33",
          "chgp": "-17.74%",
          "chgp_class": "negative"
        },
        {
          "field": "Interest",
          "val1": "4.70",
          "val2": "4.65",
          "chgp": "1.08%",
          "chgp_class": "negative"
        },
        {
          "field": "Exceptional Items",
          "val1": "0.00",
          "val2": "0.00",
          "chgp": "",
          "chgp_class": "neutral"
        },
        {
          "field": "Standalone Net Profit",
          "val1": "2.36",
          "val2": "3.38",
          "chgp": "-30.18%",
          "chgp_class": "negative"
        },
        {
          "field": "Operating Profit Margin (Excl OI)",
          "val1": "12.94%",
          "val2": "13.56%",
          "chgp": "-0.62%",
          "chgp_class": "negative"
        }
      ]
    }
  },
  {
    "link": "half-yearly",
    "btn_text": "All Half Yearly Results",
    "header": "Half Yearly Results Snapshot (Standalone) - Sep'25",
    "rhs": [
      {
        "prefix": "Net Sales ",
        "suffix": " Growth in half year ended Sep 2025 is -7.23% vs 7.64% in Sep 2024",
        "dir": -1
      },
      {
        "prefix": "Standalone Net Profit ",
        "suffix": " Growth in half year ended Sep 2025 is -19.27% vs 24.96% in Sep 2024",
        "dir": -1
      }
    ],
    "table": {
      "header": [
        "Sep'25",
        "Sep'24",
        "Change(%)"
      ],
      "body": [
        {
          "field": "Net Sales",
          "val1": "155.56",
          "val2": "167.68",
          "chgp": "-7.23%",
          "chgp_class": "negative"
        },
        {
          "field": "Operating Profit (PBDIT) excl Other Income",
          "val1": "20.67",
          "val2": "23.48",
          "chgp": "-11.97%",
          "chgp_class": "negative"
        },
        {
          "field": "Interest",
          "val1": "9.35",
          "val2": "7.16",
          "chgp": "30.59%",
          "chgp_class": "negative"
        },
        {
          "field": "Exceptional Items",
          "val1": "0.00",
          "val2": "0.00",
          "chgp": "",
          "chgp_class": "neutral"
        },
        {
          "field": "Standalone Net Profit",
          "val1": "5.74",
          "val2": "7.11",
          "chgp": "-19.27%",
          "chgp_class": "negative"
        },
        {
          "field": "Operating Profit Margin (Excl OI)",
          "val1": "13.29%",
          "val2": "14.00%",
          "chgp": "-0.71%",
          "chgp_class": "negative"
        }
      ]
    }
  },
  {
    "link": "nine-monthly",
    "btn_text": "All Nine Monthly Results",
    "header": "Nine Monthly Results Snapshot (Standalone) - Dec'24",
    "rhs": [
      {
        "prefix": "Net Sales ",
        "suffix": "YoY Growth in nine months ended Dec 2024 is 8.52% vs 19.30% in Dec 2023",
        "dir": -1
      },
      {
        "prefix": "Standalone Net Profit ",
        "suffix": "YoY Growth in nine months ended Dec 2024 is 57.35% vs 424.22% in Dec 2023",
        "dir": -1
      }
    ],
    "table": {
      "header": [
        "Dec'24",
        "Dec'23",
        "Change(%)"
      ],
      "body": [
        {
          "field": "Net Sales",
          "val1": "264.80",
          "val2": "244.00",
          "chgp": "8.52%",
          "chgp_class": "positive"
        },
        {
          "field": "Operating Profit (PBDIT) excl Other Income",
          "val1": "37.41",
          "val2": "29.66",
          "chgp": "26.13%",
          "chgp_class": "positive"
        },
        {
          "field": "Interest",
          "val1": "11.20",
          "val2": "9.98",
          "chgp": "12.22%",
          "chgp_class": "negative"
        },
        {
          "field": "Exceptional Items",
          "val1": "0.00",
          "val2": "0.00",
          "chgp": "",
          "chgp_class": "neutral"
        },
        {
          "field": "Standalone Net Profit",
          "val1": "13.06",
          "val2": "8.30",
          "chgp": "57.35%",
          "chgp_class": "positive"
        },
        {
          "field": "Operating Profit Margin (Excl OI)",
          "val1": "14.13%",
          "val2": "12.16%",
          "chgp": "1.97%",
          "chgp_class": "positive"
        }
      ]
    }
  },
  {
    "link": "annual",
    "btn_text": "All Annual Results",
    "header": "Annual Results Snapshot (Standalone) - Mar'25",
    "rhs": [
      {
        "prefix": "Net Sales ",
        "suffix": "YoY Growth in year ended Mar 2025 is 11.02% vs 12.63% in Mar 2024",
        "dir": -1
      },
      {
        "prefix": "Standalone Net Profit ",
        "suffix": "YoY Growth in year ended Mar 2025 is 46.11% vs 1,228.74% in Mar 2024",
        "dir": -1
      }
    ],
    "table": {
      "header": [
        "Mar'25",
        "Mar'24",
        "Change(%)"
      ],
      "body": [
        {
          "field": "Net Sales",
          "val1": "362.27",
          "val2": "326.31",
          "chgp": "11.02%",
          "chgp_class": "positive"
        },
        {
          "field": "Operating Profit (PBDIT) excl Other Income",
          "val1": "52.29",
          "val2": "39.28",
          "chgp": "33.12%",
          "chgp_class": "positive"
        },
        {
          "field": "Interest",
          "val1": "15.69",
          "val2": "13.35",
          "chgp": "17.53%",
          "chgp_class": "negative"
        },
        {
          "field": "Exceptional Items",
          "val1": "0.00",
          "val2": "0.00",
          "chgp": "",
          "chgp_class": "neutral"
        },
        {
          "field": "Standalone Net Profit",
          "val1": "16.89",
          "val2": "11.56",
          "chgp": "46.11%",
          "chgp_class": "positive"
        },
        {
          "field": "Operating Profit Margin (Excl OI)",
          "val1": "14.43%",
          "val2": "12.04%",
          "chgp": "2.39%",
          "chgp_class": "positive"
        }
      ]
    }
  }
]
Quarterly Results Snapshot (Standalone) - Sep'25 - QoQstock-summary
Sep'25
Jun'25
Change(%)
Net Sales
72.00
83.56
-13.83%
Operating Profit (PBDIT) excl Other Income
9.32
11.33
-17.74%
Interest
4.70
4.65
1.08%
Exceptional Items
0.00
0.00
Standalone Net Profit
2.36
3.38
-30.18%
Operating Profit Margin (Excl OI)
12.94%
13.56%
-0.62%
Values in Rs Cr.
Direction Arrows
Net Sales

QoQ Growth in quarter ended Sep 2025 is -13.83% vs -14.27% in Jun 2025

Direction Arrows
Standalone Net Profit

QoQ Growth in quarter ended Sep 2025 is -30.18% vs -11.98% in Jun 2025

Half Yearly Results Snapshot (Standalone) - Sep'25stock-summary
Sep'25
Sep'24
Change(%)
Net Sales
155.56
167.68
-7.23%
Operating Profit (PBDIT) excl Other Income
20.67
23.48
-11.97%
Interest
9.35
7.16
30.59%
Exceptional Items
0.00
0.00
Standalone Net Profit
5.74
7.11
-19.27%
Operating Profit Margin (Excl OI)
13.29%
14.00%
-0.71%
Values in Rs Cr.
Direction Arrows
Net Sales

Growth in half year ended Sep 2025 is -7.23% vs 7.64% in Sep 2024

Direction Arrows
Standalone Net Profit

Growth in half year ended Sep 2025 is -19.27% vs 24.96% in Sep 2024

Nine Monthly Results Snapshot (Standalone) - Dec'24stock-summary
Dec'24
Dec'23
Change(%)
Net Sales
264.80
244.00
8.52%
Operating Profit (PBDIT) excl Other Income
37.41
29.66
26.13%
Interest
11.20
9.98
12.22%
Exceptional Items
0.00
0.00
Standalone Net Profit
13.06
8.30
57.35%
Operating Profit Margin (Excl OI)
14.13%
12.16%
1.97%
Values in Rs Cr.
Direction Arrows
Net Sales

YoY Growth in nine months ended Dec 2024 is 8.52% vs 19.30% in Dec 2023

Direction Arrows
Standalone Net Profit

YoY Growth in nine months ended Dec 2024 is 57.35% vs 424.22% in Dec 2023

Annual Results Snapshot (Standalone) - Mar'25stock-summary
Mar'25
Mar'24
Change(%)
Net Sales
362.27
326.31
11.02%
Operating Profit (PBDIT) excl Other Income
52.29
39.28
33.12%
Interest
15.69
13.35
17.53%
Exceptional Items
0.00
0.00
Standalone Net Profit
16.89
11.56
46.11%
Operating Profit Margin (Excl OI)
14.43%
12.04%
2.39%
Values in Rs Cr.
Direction Arrows
Net Sales

YoY Growth in year ended Mar 2025 is 11.02% vs 12.63% in Mar 2024

Direction Arrows
Standalone Net Profit

YoY Growth in year ended Mar 2025 is 46.11% vs 1,228.74% in Mar 2024

stock-summaryCompany CV
About Synergy Green Industries Ltd stock-summary
stock-summary
Synergy Green Industries Ltd
Micro Cap
Castings & Forgings
Synergy Green Industries Limited was originally incorporated as a Private Limited Company with the name as "Synergy Green Industries Private Limited" on October 08, 2010. Further, The Company converted into Public Limited Company and name was changed to "Synergy Green Industries Limited" on February 16, 2018. The Company is engaged in the business of foundry i.e. manufacturing of castings, industrial castings, turbine castings, metal castings, steel castings and Windmill Parts.
Company Coordinates stock-summary
Company Details
392 E Ward Assembly road, Shahupuri Kolhapur Maharashtra : 416001
stock-summary
Tel: 91-0231-2658375
stock-summary
info@synergygreenind.com
Registrar Details
Link Intime India Pvt Ltd, C-13 Pannalal Silk Compound, L B S Marg, Bhandup , Mumbai