
Compare Synergy Green with Similar Stocks
Dashboard
High Debt company with Weak Long Term Fundamental Strength
- Poor long term growth as Net Sales has grown by an annual rate of 12.98% and Operating profit at 3.74% over the last 5 years
- Company's ability to service its debt is weak with a poor EBIT to Interest (avg) ratio of 1.53
With a fall in Operating Profit of -4.73%, the company declared Very Negative results in Mar 26
Stock DNA
Castings & Forgings
INR 862 Cr (Micro Cap)
161.00
45
0.19%
2.15
4.78%
7.55
Total Returns (Price + Dividend) 
Latest dividend: 1 per share ex-dividend date: Sep-17-2025
Risk Adjusted Returns v/s
Returns Beta

News

Synergy Green Industries Ltd Technical Momentum Shifts Signal Bullish Outlook
Synergy Green Industries Ltd, a micro-cap player in the Castings & Forgings sector, has experienced a notable shift in its technical momentum, moving from a mildly bullish to a bullish trend. Despite a marginal day decline of 0.05%, the stock’s technical indicators present a complex picture, with mixed signals across weekly and monthly timeframes. This article analyses the recent technical developments, price momentum, and relative performance against the Sensex to provide a comprehensive view for investors.
Read full news article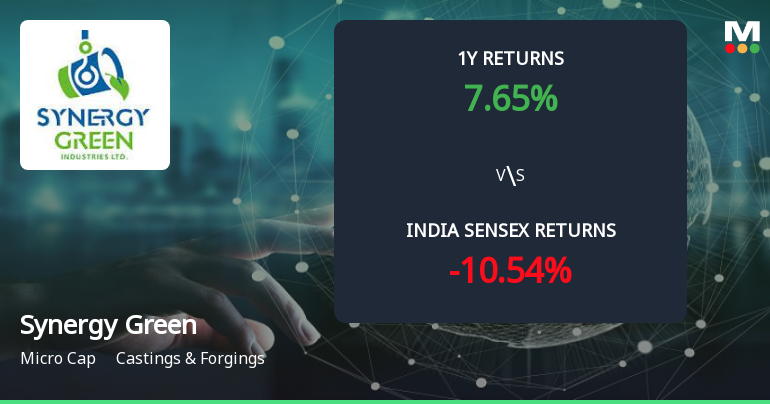
Golden Cross Forms in Synergy Green Industries Ltd — On a Day the Stock Fell 3.38%. What the Mixed Signals Mean
The 50-day moving average has crossed above the 200-day moving average for Synergy Green Industries Ltd, signalling a golden cross on 8 Jun 2026. Yet, the stock declined 3.38% on the same day, while monthly momentum indicators remain mildly bearish. This juxtaposition of signals calls for a detailed examination of the technical and fundamental context to assess the reliability of this crossover.
Read full news article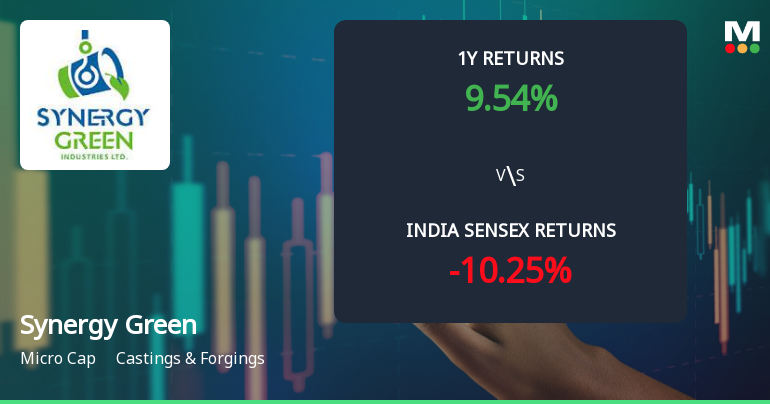
Synergy Green Industries Ltd Technical Momentum Shifts Amid Mixed Indicator Signals
Synergy Green Industries Ltd, a micro-cap player in the Castings & Forgings sector, has experienced a nuanced shift in its technical momentum, moving from a sideways trend to a mildly bullish stance on weekly charts. Despite a recent day decline of 3.36%, the stock’s technical indicators present a complex picture, with bullish signals on some timeframes counterbalanced by bearish cues on others, prompting a reassessment of its outlook by market analysts.
Read full news article Announcements
Disclosures under Reg. 29(2) of SEBI (SAST) Regulations 2011
01-Jun-2026 | Source : BSEThe Exchange has received the disclosure under Regulation 29(2) of SEBI (Substantial Acquisition of Shares & Takeovers) Regulations 2011 for Solidarity Advisors Pvt Ltd
Compliances-Reg.24(A)-Annual Secretarial Compliance
26-May-2026 | Source : BSESubmission of Annual Compliance Report for the FY ended on 31.03.2026 of Synergy Green Industries Limited.
Announcement under Regulation 30 (LODR)-Analyst / Investor Meet - Outcome
22-May-2026 | Source : BSESubmission of Transcript of Investors Meeting held on 19.05.2026.
Corporate Actions

No Upcoming Board Meetings

Synergy Green Industries Ltd has declared 10% dividend, ex-date: 17 Sep 25

No Splits history available

No Bonus history available

Synergy Green Industries Ltd has announced 1:10 rights issue, ex-date: 11 Sep 24
Quality key factors
Valuation key factors
Technicals key factors
 Technical Indicator Scale: Bearish, Mildly Bearish, Sideways, Mildly Bullish, Bullish Turned
 Shareholding Snapshot : Mar 2026
Shareholding Compare (%holding)
Promoters
None
Held by 0 Schemes
Held by 3 FIIs (0.22%)
S B Reshellers Private Limited (34.81%)
Aniruddha Narayan Malpani (1.89%)
23.47%
Quarterly Results Snapshot (Standalone) - Mar'26 - QoQ

QoQ Growth in quarter ended Mar 2026 is 29.64% vs 27.53% in Dec 2025
QoQ Growth in quarter ended Mar 2026 is 127.52% vs -163.14% in Dec 2025
Half Yearly Results Snapshot (Standalone) - Sep'25

Growth in half year ended Sep 2025 is -7.23% vs 7.64% in Sep 2024
Growth in half year ended Sep 2025 is -19.27% vs 24.96% in Sep 2024
Nine Monthly Results Snapshot (Standalone) - Dec'25
YoY Growth in nine months ended Dec 2025 is -6.58% vs 8.52% in Dec 2024
YoY Growth in nine months ended Dec 2025 is -67.46% vs 57.35% in Dec 2024
Annual Results Snapshot (Standalone) - Mar'26
YoY Growth in year ended Mar 2026 is 1.15% vs 11.02% in Mar 2025
YoY Growth in year ended Mar 2026 is -72.41% vs 46.11% in Mar 2025
About Synergy Green Industries Ltd

Company Coordinates


