Syngene Intl.

  • Market Cap: Small Cap
  • Industry: Healthcare Services
  • ISIN: INE398R01022
  • NSEID: SYNGENE
  • BSEID: 539268
INR
407.30
5.85 (1.46%)
BSENSE

Aug 04, 03:30 PM

BSE+NSE Vol: 9.69 lacs

  • Price Points
  • Score
  • Mojo Parameters
  • Total Return
  • News and Corporate Actions
  • Key factors
  • Shareholding
  • Financials
  • CompanyCV
stock-summaryPrice Point
High/Low

1Day

52 Week

Valuation
Technical
Day's Volume

CASH

9.69 lacs (-79.53%) Volume

Shareholding (Jun 2026)

FII

11.82%

Held by 187 FIIs

DII

28.01%

Held by 47 DIIs

Promoter

52.59%

Why is Syngene International Ltd falling/rising?

03-Aug-2026

As of 03-Aug, Syngene International Ltd's stock price is rising to 401.45, reflecting a 4.1% increase due to a trend reversal and increased investor interest. However, the company faces significant long-term challenges, including a -28.99% decline in net sales and a -95.0% drop in profit after tax compared to the previous quarter.

As of 03-Aug, Syngene International Ltd's stock price is rising, currently at 401.45, reflecting a change of 15.8 (4.1%) upwards. This increase can be attributed to a trend reversal after two consecutive days of decline, indicating a potential shift in market sentiment. Additionally, the stock has outperformed its sector by 3.33% today, which may have attracted more investor interest.<BR><BR>The stock reached an intraday high of Rs 403.6, showcasing positive momentum within the trading day. Furthermore, there has been a rise in investor participation, with delivery volume increasing by 1.35% compared to the 5-day average, suggesting that more investors are willing to hold the stock rather than trade it quickly.<BR><BR>Despite these positive indicators, it is important to note that Syngene International Ltd has faced significant challenges in the longer term. The company has reported a decline in net sales of -28.99% and a substantial drop in profit after tax, which fell by -95.0% compared to the previous quarter's average. The stock has consistently underperformed against benchmarks over the past year and three years, with a return of -42.84% in the last year alone.<BR><BR>In summary, while the stock is currently rising due to short-term positive performance and increased investor participation, it is still grappling with serious long-term growth issues and underperformance relative to market benchmarks.

View full answer

Should I buy, sell or hold Syngene International Ltd?

31-Jul-2026

Are Syngene International Ltd latest results good or bad?

30-Jul-2026

Syngene International Ltd's latest results are concerning, showing a net loss of ₹9.00 crores in Q1 FY27, a significant decline from a profit of ₹147.90 crores in the previous quarter, alongside a 15.84% drop in revenue and a low operating margin of 12.34%. These trends indicate serious operational challenges and raise concerns about the company's future sustainability and growth.

The latest results for Syngene International Ltd are concerning and indicate a significant decline in profitability. In Q1 FY27, the company reported a net loss of ₹9.00 crores, marking its first quarterly loss in recent history. This is a stark contrast to the profit of ₹147.90 crores reported in the previous quarter (Q4 FY26).<BR><BR>Revenue also took a hit, declining by 15.84% year-on-year to ₹736.00 crores, which is the lowest quarterly revenue figure in over two years. The operating margin collapsed to 12.34%, down from 23.60% a year earlier, representing the lowest operating margin recorded in the last twelve quarters. This sharp decline in margins raises questions about the company's cost management and pricing power in a competitive environment.<BR><BR>Additionally, the return on equity (ROE) stands at a weak 7.41%, indicating poor capital efficiency. The operational challenges are compounded by a significant year-on-year decline in operating profit, which fell by 56.01% to ₹90.80 crores.<BR><BR>Overall, these results reflect a troubling trend for Syngene, suggesting that the company is facing serious challenges that could impact its future sustainability and growth. Investors should be cautious and closely monitor the company's performance moving forward.

View full answer

How big is Syngene Intl.?

11-Jun-2026

As of 10th June, Syngene International Ltd has a market capitalization of 18,127.00 Cr, with recent net sales of 3,738.70 Cr and a net profit of 316.70 Cr over the last four quarters.

As of 10th June, <BR><BR>Market Cap: Syngene International Ltd has a market capitalization of 18,127.00 Cr, categorizing it as a Small Cap company.<BR><BR>Recent Quarterly Performance: The sum of Net Sales for the latest 4 quarters is 3,738.70 Cr, while the sum of Net Profit for the same period is 316.70 Cr.<BR><BR>Balance Sheet Snapshot: The reporting period for the balance sheet is March 2025. Shareholder's Funds are valued at 4,726.80 Cr, and Total Assets amount to 6,766.50 Cr.

View full answer

Who are in the management team of Syngene Intl.?

11-Jun-2026

The management team of Syngene International includes Kiran Mazumdar Shaw (Chairperson), Jonathan Hunt (Managing Director & CEO), and several independent directors such as Vinita Bali and Paul Blackburn, among others, bringing diverse expertise to the company.

The management team of Syngene International includes the following key members:<BR><BR>1. **Kiran Mazumdar Shaw** - Chairperson<BR>2. **Catherine Patricia Rosenberg** - Director<BR>3. **Paul Frederick Blackburn** - Independent Director<BR>4. **Vijay Kuchroo** - Independent Director<BR>5. **Jonathan Hunt** - Managing Director & CEO<BR>6. **Vinita Bali** - Lead Independent Director<BR>7. **Priyadarshnini Mahapatra** - Company Secretary & Compliance Officer<BR>8. **Sharmila Karve** - Independent Director<BR>9. **Carl Decicco** - Director<BR>10. **Kush Parmar** - Independent Director<BR><BR>This team brings a diverse range of expertise and leadership to the company.

View full answer

Who are the peers of the Syngene Intl.?

11-Jun-2026

Syngene Intl.'s peers include Dr Lal Pathlabs, Poly Medicure, Vijaya Diagnost., Indegene, Metropolis Health, Thyrocare Tech., Suven Life Sciences, Vimta Labs, and Krsnaa Diagnost. Syngene Intl. has good management risk and an excellent capital structure, but its 1-year return is the lowest among peers at -31.13%.

Peers: The peers of Syngene Intl. are Dr Lal Pathlabs, Poly Medicure, Vijaya Diagnost., Indegene, Metropolis Healt, Thyrocare Tech., Suven Life Scie., Vimta Labs, and Krsnaa Diagnost.<BR><BR>Quality Snapshot: Excellent management risk is observed at Dr Lal Pathlabs, while Good management risk is found at Syngene Intl., Poly Medicure, Vijaya Diagnost., Metropolis Healt, and Thyrocare Tech. Average management risk is noted at Indegene, Vimta Labs, and Krsnaa Diagnost., while Below Average management risk is seen at Suven Life Scie. Growth is uniformly Below Average across all peers. Excellent capital structure is present at Dr Lal Pathlabs, Syngene Intl., Poly Medicure, Vijaya Diagnost., Metropolis Healt, Thyrocare Tech., and Krsnaa Diagnost., while Average capital structure is noted at Indegene and Vimta Labs, and Below Average at Suven Life Scie.<BR><BR>Return Snapshot: The peer with the highest 1-year return is Vijaya Diagnost. at 36.33%, while the lowest is Syngene Intl. at -31.13%. This indicates that Syngene Intl.'s 1-year return is significantly lower than that of its peers. Additionally, the six-month return is negative for Syngene Intl., Poly Medicure, and Krsnaa Diagnost.

View full answer

What does Syngene Intl. do?

10-Jun-2026

Syngene International Limited is a small-cap integrated research, development, and manufacturing services organization in the healthcare sector, reporting net sales of 1,036 Cr and a net profit of 148 Cr for the quarter ending March 2026. Key metrics include a P/E ratio of 51.00 and a market cap of INR 18,127 Cr.

Overview:<BR>Syngene International Limited is an integrated research, development, and manufacturing services organization operating in the healthcare services industry and classified as a small-cap company.<BR><BR>History:<BR>Syngene International was incorporated in an unspecified year and has maintained its status as a key player in the healthcare services sector. The latest quarterly results reported net sales and profit for the period ending March 2026.<BR><BR>Financial Snapshot:<BR>- Net Sales: 1,036 Cr (Quarterly Results - Mar 2026)<BR>- Net Profit: 148 Cr (Quarterly Results - Mar 2026)<BR>- Market Cap: INR 18,127 Cr (Small Cap)<BR><BR>Key Metrics:<BR>- P/E: 51.00<BR>- Industry P/E: 34<BR>- Dividend Yield: 0.27%<BR>- Debt Equity: -0.17<BR>- Return on Equity: 7.41%<BR>- Price to Book: 3.72<BR><BR>Contact Details:<BR>Address: Biocon SEZ Biocon Park, Plot No 2 & 3 Bommasandra Inds Bengaluru Karnataka : 560099<BR>Tel: 91-80-68915000/67758781<BR>Email: investor@syngeneintl.com<BR>Website: http://www.syngeneintl.com

View full answer

When is the next results date for Syngene International Ltd?

16-Apr-2026

The next results date for Syngene International Ltd is April 29, 2026.

The next results date for Syngene International Ltd is scheduled for April 29, 2026.

View full answer

Is Syngene Intl. technically bullish or bearish?

05-Dec-2025

As of December 4, 2025, Syngene Intl. shows a mildly bearish trend, with daily moving averages and Bollinger Bands indicating bearishness, despite some mildly bullish signals from the weekly MACD.

As of 4 December 2025, the technical trend for Syngene Intl. has changed from bearish to mildly bearish. The current stance is mildly bearish, driven by the daily moving averages indicating a bearish outlook and the weekly OBV also showing mild bearishness. The MACD on the weekly chart is mildly bullish, but the monthly MACD remains bearish, suggesting mixed signals across time frames. The Bollinger Bands are bearish on both weekly and monthly charts, reinforcing the bearish sentiment. Overall, while there are some mildly bullish indicators, the prevailing trend remains bearish.

View full answer

How has been the historical performance of Syngene Intl.?

02-Dec-2025

Syngene Intl. has shown consistent growth in net sales and operating profit from INR 1,825.60 crore in March 2019 to INR 3,642.40 crore in March 2025, although profit after tax slightly declined in 2025. Total assets and cash flow from operations have also improved significantly during this period.

Answer:<BR>The historical performance of Syngene Intl. shows a consistent growth trajectory in net sales and profits over the years.<BR><BR>Breakdown:<BR>Syngene Intl. has demonstrated a strong upward trend in net sales, increasing from INR 1,825.60 crore in March 2019 to INR 3,642.40 crore in March 2025. This growth is reflected in the total operating income, which also rose from INR 1,825.60 crore to INR 3,642.40 crore during the same period. The company's operating profit (PBDIT) has similarly improved, reaching INR 1,113.60 crore in March 2025, up from INR 611.90 crore in March 2019. However, profit after tax showed a slight decline from INR 510.00 crore in March 2024 to INR 496.20 crore in March 2025. The total assets of Syngene increased significantly from INR 4,040.20 crore in March 2020 to INR 6,766.50 crore in March 2025, while total liabilities also rose from INR 4,040.20 crore to INR 6,766.50 crore in the same timeframe. Cash flow from operating activities has improved, reaching INR 1,167.00 crore in March 2025, compared to INR 677.00 crore in March 2020, indicating a positive cash generation trend. Overall, Syngene Intl. has shown robust growth in revenue and operational efficiency, despite some fluctuations in net profit.

View full answer

Who are the top shareholders of the Syngene Intl.?

06-Jun-2025

The top shareholders of Syngene International are Biocon Limited with 52.46%, mutual funds at 17.86%, and foreign institutional investors holding 19.47%. The highest public shareholder is ICICI Prudential Innovation Fund with a 5.13% stake, while individual investors own about 5.08%.

The top shareholders of Syngene International include Biocon Limited, which holds the largest stake at 52.46%. Other significant shareholders are mutual funds, which collectively own 17.86% of the company, and foreign institutional investors (FIIs) who hold 19.47%. The highest public shareholder is ICICI Prudential Innovation Fund, with a 5.13% stake. Additionally, individual investors own about 5.08% of the shares.

View full answer

What is the bonus history of the Syngene Intl.?

06-Jun-2025

Syngene International Ltd announced a 1:1 bonus issue on June 11, 2019, with a record date of June 12, 2019, allowing shareholders to receive one additional share for each share held.

Syngene International Ltd has a bonus history that includes a 1:1 bonus issue announced on June 11, 2019. The record date for this bonus was June 12, 2019. This means that shareholders received one additional share for every share they held as of the record date.

View full answer

Has Syngene Intl. declared dividend?

06-Jun-2025

Syngene International Ltd has declared a dividend of 12% (₹1.2 per share) with an ex-date of June 28, 2024. While recent total returns have been negative, longer-term performance shows positive growth.

Syngene International Ltd has declared a dividend.<BR><BR>Dividend Details:<BR>- Percentage announced: 12%<BR>- Amount per share: 1.2<BR>- Ex-date: Jun-28-2024<BR><BR>Dividend Yield: 0.19%.<BR><BR>Total Returns by Period:<BR>In the last 6 months, the price return was -30.02%, the dividend return was 0.14%, resulting in a total return of -29.88%.<BR><BR>Over the past year, the price return was -5.96%, the dividend return was 0.34%, leading to a total return of -5.62%.<BR><BR>For the 2-year period, the price return was -12.31%, the dividend return was 0.42%, culminating in a total return of -11.89%.<BR><BR>In the last 3 years, the price return was 20.73%, the dividend return was 0.65%, resulting in a total return of 21.38%.<BR><BR>Over the past 4 years, the price return was 9.33%, the dividend return was 0.62%, leading to a total return of 9.95%.<BR><BR>In the 5-year period, the price return was 74.97%, the dividend return was 0.89%, culminating in a total return of 75.86%.<BR><BR>Overall, while Syngene International Ltd has declared a dividend, the total returns over various periods show a mixed performance, with significant declines in the short term but positive returns over the longer term.

View full answer
iScoreScore
Click here to find our call on this stock
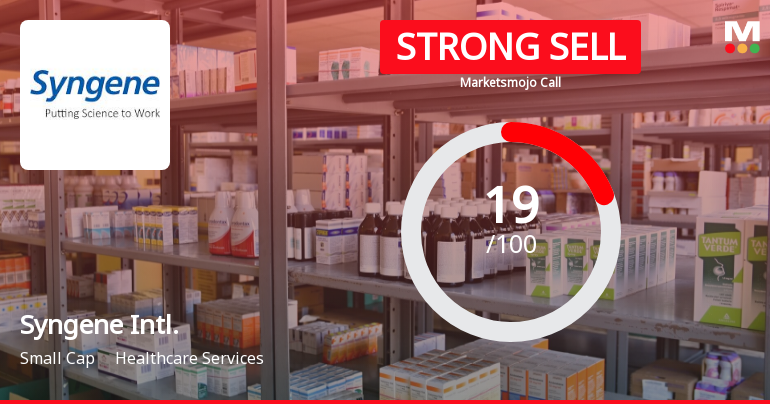
Strong Sell
Sell
Hold
Buy
Strong Buy

Dashboard

1

Poor long term growth as Operating profit has grown by an annual rate -4.05% of over the last 5 years

 
2

With a fall in Net Sales of -28.99%, the company declared Very Negative results in Jun 26

3

With ROE of 7.4, it has a Very Expensive valuation with a 3.3 Price to Book Value

4

Consistent Underperformance against the benchmark over the last 3 years

stock-summaryMojo Parameters

Mojo Parameters

Loading Valuation Snapshot...

Stock DNA

stock-summary
Industry

Healthcare Services

stock-summary
Market cap

INR 16,264 Cr (Small Cap)

stock-summary
P/E

58.00

stock-summary
Industry P/E

37

stock-summary
Dividend Yield

0.30%

stock-summary
Debt Equity

-0.17

stock-summary
Return on Equity

7.41%

stock-summary
Price to Book

3.34

Revenue and Profits:
Net Sales:
736 Cr
(Quarterly Results - Jun 2026)
Net Profit:
-9 Cr
stock-summaryTotal Returns
Total Returns (Price + Dividend) stock-summary
Dividend Yield (0.3%)
TimePeriod
Price Return
Dividend Return
Total Return
3 Months
-14.7%
0.26%
-14.44%
6 Months
-13.72%
0.27%
-13.45%
1 Year
-42.24%
0.19%
-42.05%
2 Years
-50.32%
0.29%
-50.03%
3 Years
-49.73%
0.44%
-49.29%
4 Years
-28.59%
0.72%
-27.87%
5 Years
-34.38%
0.75%
-33.63%

Latest dividend: 1.2 per share ex-dividend date: Jun-25-2026

Risk Adjusted Returns v/s stock-summary
Returns Beta
Icon
Beta has not been calculated since enough price history is not available
stock-summaryNews & Corporate Actions

News

Syngene International Ltd Falls 5.15% Amidst Bearish Momentum and Financial Setbacks

Announcements stock-summary

Shareholder Meeting / Postal Ballot-Scrutinizers Report

31-Jul-2026 | Source : BSE

Scrutinizers Report and voting results of 33rd Annual General Meeting

Announcement under Regulation 30 (LODR)-Analyst / Investor Meet - Outcome

30-Jul-2026 | Source : BSE

Intimation of audio recording for Q1 FY27 post-earnings call

Announcement under Regulation 30 (LODR)-Newspaper Publication

30-Jul-2026 | Source : BSE

Newspaper Advertisement - Financial Results

Corporate Actions stock-summary

stock-summary
BOARD MEETING

No Upcoming Board Meetings

stock-summary
DIVIDEND

Syngene International Ltd has declared 12% dividend, ex-date: 25 Jun 26

stock-summary
SPLITS

No Splits history available

stock-summary
BONUS

Syngene International Ltd has announced 1:1 bonus issue, ex-date: 11 Jun 19

stock-summary
RIGHTS

No Rights history available

stock-summaryKey Factors

Quality key factors stock-summary

Factor
Value
Sales Growth (5y)
8.84%
EBIT Growth (5y)
-4.05%
EBIT to Interest (avg)
12.48
Debt to EBITDA (avg)
0.82
Net Debt to Equity (avg)
-0.17
Sales to Capital Employed (avg)
0.69
Tax Ratio
23.90%
Dividend Payout Ratio
10.14%
Pledged Shares
0
Institutional Holding
39.83%
ROCE (avg)
15.48%
ROE (avg)
11.03%

Valuation key factors

Factor
Value
P/E Ratio
58
Industry P/E
37
Price to Book Value
3.34
EV to EBIT
43.87
EV to EBITDA
19.07
EV to Capital Employed
3.82
EV to Sales
4.25
PEG Ratio
NA
Dividend Yield
0.30%
ROCE (Latest)
11.62%
ROE (Latest)
7.41%

Technicals key factors

Indicator
Weekly
Monthly
MACD
Mildly Bullish
Bearish
RSI
No Signal
No Signal
Bollinger Bands
Mildly Bearish
Mildly Bearish
Moving Averages
Bearish (Daily)
KST
Mildly Bullish
Bearish
Dow Theory
No Trend
No Trend
OBV
No Trend
No Trend
stock-summary Technical Indicator Scale: Bearish, Mildly Bearish, Sideways, Mildly Bullish, Bullish  Turned 
stock-summaryShareholding
Shareholding Snapshot : Jun 2026stock-summary
Shareholding Compare (%holding) stock-summary
Majority shareholders

Promoters

Pledged Promoter Holdings

None

Mutual Funds

Held by 26 Schemes (25.78%)

FIIs

Held by 187 FIIs (11.82%)

Promoter with highest holding

Biocon Limited (52.32%)

Highest Public shareholder

Nippon Life India Trustee Ltd- A/c Nippon India Fo (7.73%)

Individual Investors Holdings

6.14%

stock-summaryFinancial
[
  {
    "link": "quarterly",
    "btn_text": "All Quarterly Results",
    "header": "Quarterly Results Snapshot (Consolidated) - Jun'26 - QoQ",
    "rhs": [
      {
        "prefix": "Net Sales ",
        "suffix": "QoQ Growth in quarter ended Jun 2026 is -28.99% vs 13.02% in Mar 2026",
        "dir": -1
      },
      {
        "prefix": "Consolidated Net Profit ",
        "suffix": "QoQ Growth in quarter ended Jun 2026 is -106.09% vs 886.00% in Mar 2026",
        "dir": -1
      }
    ],
    "table": {
      "header": [
        "Jun'26",
        "Mar'26",
        "Change(%)"
      ],
      "body": [
        {
          "field": "Net Sales",
          "val1": "736.00",
          "val2": "1,036.50",
          "chgp": "-28.99%",
          "chgp_class": "negative"
        },
        {
          "field": "Operating Profit (PBDIT) excl Other Income",
          "val1": "90.80",
          "val2": "303.40",
          "chgp": "-70.07%",
          "chgp_class": "negative"
        },
        {
          "field": "Interest",
          "val1": "9.60",
          "val2": "12.10",
          "chgp": "-20.66%",
          "chgp_class": "positive"
        },
        {
          "field": "Exceptional Items",
          "val1": "-13.50",
          "val2": "-6.00",
          "chgp": "-125.00%",
          "chgp_class": "negative"
        },
        {
          "field": "Consolidate Net Profit",
          "val1": "-9.00",
          "val2": "147.90",
          "chgp": "-106.09%",
          "chgp_class": "negative"
        },
        {
          "field": "Operating Profit Margin (Excl OI)",
          "val1": "12.34%",
          "val2": "29.27%",
          "chgp": "-16.93%",
          "chgp_class": "negative"
        }
      ]
    }
  },
  {
    "link": "half-yearly",
    "btn_text": "All Half Yearly Results",
    "header": "Half Yearly Results Snapshot (Consolidated) - Sep'25",
    "rhs": [
      {
        "prefix": "Net Sales ",
        "suffix": " Growth in half year ended Sep 2025 is 6.21% vs -2.18% in Sep 2024",
        "dir": 1
      },
      {
        "prefix": "Consolidated Net Profit ",
        "suffix": " Growth in half year ended Sep 2025 is -15.40% vs -13.39% in Sep 2024",
        "dir": -1
      }
    ],
    "table": {
      "header": [
        "Sep'25",
        "Sep'24",
        "Change(%)"
      ],
      "body": [
        {
          "field": "Net Sales",
          "val1": "1,785.10",
          "val2": "1,680.70",
          "chgp": "6.21%",
          "chgp_class": "positive"
        },
        {
          "field": "Operating Profit (PBDIT) excl Other Income",
          "val1": "405.90",
          "val2": "414.60",
          "chgp": "-2.10%",
          "chgp_class": "negative"
        },
        {
          "field": "Interest",
          "val1": "24.80",
          "val2": "24.80",
          "chgp": "",
          "chgp_class": "neutral"
        },
        {
          "field": "Exceptional Items",
          "val1": "0.00",
          "val2": "32.00",
          "chgp": "-100.00%",
          "chgp_class": "negative"
        },
        {
          "field": "Consolidate Net Profit",
          "val1": "153.80",
          "val2": "181.80",
          "chgp": "-15.40%",
          "chgp_class": "negative"
        },
        {
          "field": "Operating Profit Margin (Excl OI)",
          "val1": "22.74%",
          "val2": "24.67%",
          "chgp": "-1.93%",
          "chgp_class": "negative"
        }
      ]
    }
  },
  {
    "link": "nine-monthly",
    "btn_text": "All Nine Monthly Results",
    "header": "Nine Monthly Results Snapshot (Consolidated) - Dec'25",
    "rhs": [
      {
        "prefix": "Net Sales ",
        "suffix": "YoY Growth in nine months ended Dec 2025 is 2.96% vs 2.05% in Dec 2024",
        "dir": 1
      },
      {
        "prefix": "Consolidated Net Profit ",
        "suffix": "YoY Growth in nine months ended Dec 2025 is -46.05% vs -2.64% in Dec 2024",
        "dir": -1
      }
    ],
    "table": {
      "header": [
        "Dec'25",
        "Dec'24",
        "Change(%)"
      ],
      "body": [
        {
          "field": "Net Sales",
          "val1": "2,702.20",
          "val2": "2,624.40",
          "chgp": "2.96%",
          "chgp_class": "positive"
        },
        {
          "field": "Operating Profit (PBDIT) excl Other Income",
          "val1": "615.10",
          "val2": "698.20",
          "chgp": "-11.90%",
          "chgp_class": "negative"
        },
        {
          "field": "Interest",
          "val1": "36.70",
          "val2": "37.20",
          "chgp": "-1.34%",
          "chgp_class": "positive"
        },
        {
          "field": "Exceptional Items",
          "val1": "-70.60",
          "val2": "32.00",
          "chgp": "-320.62%",
          "chgp_class": "negative"
        },
        {
          "field": "Consolidate Net Profit",
          "val1": "168.80",
          "val2": "312.90",
          "chgp": "-46.05%",
          "chgp_class": "negative"
        },
        {
          "field": "Operating Profit Margin (Excl OI)",
          "val1": "22.76%",
          "val2": "26.60%",
          "chgp": "-3.84%",
          "chgp_class": "negative"
        }
      ]
    }
  },
  {
    "link": "annual",
    "btn_text": "All Annual Results",
    "header": "Annual Results Snapshot (Consolidated) - Mar'26",
    "rhs": [
      {
        "prefix": "Net Sales ",
        "suffix": "YoY Growth in year ended Mar 2026 is 2.64% vs 4.41% in Mar 2025",
        "dir": -1
      },
      {
        "prefix": "Consolidated Net Profit ",
        "suffix": "YoY Growth in year ended Mar 2026 is -36.17% vs -2.71% in Mar 2025",
        "dir": -1
      }
    ],
    "table": {
      "header": [
        "Mar'26",
        "Mar'25",
        "Change(%)"
      ],
      "body": [
        {
          "field": "Net Sales",
          "val1": "3,738.70",
          "val2": "3,642.40",
          "chgp": "2.64%",
          "chgp_class": "positive"
        },
        {
          "field": "Operating Profit (PBDIT) excl Other Income",
          "val1": "918.50",
          "val2": "1,041.80",
          "chgp": "-11.84%",
          "chgp_class": "negative"
        },
        {
          "field": "Interest",
          "val1": "48.80",
          "val2": "53.10",
          "chgp": "-8.10%",
          "chgp_class": "positive"
        },
        {
          "field": "Exceptional Items",
          "val1": "-76.60",
          "val2": "32.00",
          "chgp": "-339.38%",
          "chgp_class": "negative"
        },
        {
          "field": "Consolidate Net Profit",
          "val1": "316.70",
          "val2": "496.20",
          "chgp": "-36.17%",
          "chgp_class": "negative"
        },
        {
          "field": "Operating Profit Margin (Excl OI)",
          "val1": "24.57%",
          "val2": "28.60%",
          "chgp": "-4.03%",
          "chgp_class": "negative"
        }
      ]
    }
  }
]

Quarterly Results Snapshot (Consolidated) - Jun'26 - QoQstock-summary

Jun'26
Mar'26
Change(%)
Net Sales
736.00
1,036.50
-28.99%
Operating Profit (PBDIT) excl Other Income
90.80
303.40
-70.07%
Interest
9.60
12.10
-20.66%
Exceptional Items
-13.50
-6.00
-125.00%
Consolidate Net Profit
-9.00
147.90
-106.09%
Operating Profit Margin (Excl OI)
12.34%
29.27%
-16.93%
Values in Rs Cr.
Direction Arrows
Net Sales

QoQ Growth in quarter ended Jun 2026 is -28.99% vs 13.02% in Mar 2026

Direction Arrows
Consolidated Net Profit

QoQ Growth in quarter ended Jun 2026 is -106.09% vs 886.00% in Mar 2026

Half Yearly Results Snapshot (Consolidated) - Sep'25stock-summary

Sep'25
Sep'24
Change(%)
Net Sales
1,785.10
1,680.70
6.21%
Operating Profit (PBDIT) excl Other Income
405.90
414.60
-2.10%
Interest
24.80
24.80
Exceptional Items
0.00
32.00
-100.00%
Consolidate Net Profit
153.80
181.80
-15.40%
Operating Profit Margin (Excl OI)
22.74%
24.67%
-1.93%
Values in Rs Cr.
Direction Arrows
Net Sales

Growth in half year ended Sep 2025 is 6.21% vs -2.18% in Sep 2024

Direction Arrows
Consolidated Net Profit

Growth in half year ended Sep 2025 is -15.40% vs -13.39% in Sep 2024

Nine Monthly Results Snapshot (Consolidated) - Dec'25stock-summary

Dec'25
Dec'24
Change(%)
Net Sales
2,702.20
2,624.40
2.96%
Operating Profit (PBDIT) excl Other Income
615.10
698.20
-11.90%
Interest
36.70
37.20
-1.34%
Exceptional Items
-70.60
32.00
-320.62%
Consolidate Net Profit
168.80
312.90
-46.05%
Operating Profit Margin (Excl OI)
22.76%
26.60%
-3.84%
Values in Rs Cr.
Direction Arrows
Net Sales

YoY Growth in nine months ended Dec 2025 is 2.96% vs 2.05% in Dec 2024

Direction Arrows
Consolidated Net Profit

YoY Growth in nine months ended Dec 2025 is -46.05% vs -2.64% in Dec 2024

Annual Results Snapshot (Consolidated) - Mar'26stock-summary

Mar'26
Mar'25
Change(%)
Net Sales
3,738.70
3,642.40
2.64%
Operating Profit (PBDIT) excl Other Income
918.50
1,041.80
-11.84%
Interest
48.80
53.10
-8.10%
Exceptional Items
-76.60
32.00
-339.38%
Consolidate Net Profit
316.70
496.20
-36.17%
Operating Profit Margin (Excl OI)
24.57%
28.60%
-4.03%
Values in Rs Cr.
Direction Arrows
Net Sales

YoY Growth in year ended Mar 2026 is 2.64% vs 4.41% in Mar 2025

Direction Arrows
Consolidated Net Profit

YoY Growth in year ended Mar 2026 is -36.17% vs -2.71% in Mar 2025

stock-summaryCompany CV
About Syngene International Ltd stock-summary
stock-summary
Syngene International Ltd
Small Cap
Healthcare Services
Syngene International Limited is an integrated research, development and manufacturing services organization serving global pharmaceutical, biotechnology, nutrition, animal health, consumer goods and specialty chemical sectors. Headquartered in India, the operations are driven by its highly qualified teams comprising ~6000 scientists and its state-of-the-art facilities, spread over 2.2 million sq. ft., across 3 locations in India: Bangalore, Hyderabad and Mangalore.
Company Coordinates stock-summary
Company Details
Biocon SEZ Biocon Park, Plot No 2 & 3 Bommasandra Inds Bengaluru Karnataka : 560099
stock-summary
Tel: 91-80-68915000/67758781
stock-summary
investor@syngeneintl.com
Registrar Details
Karvy Computershare Pvt Ltd., Karvy Selenium, Tower-B Plot No 31 & 32, Survey No 116/22, 115/24, 115/25, Financial District, Nanakramguda, Serilingampally, Mandal Ranga Reddy Dist, Hyderabad