
Compare Syngene Intl. with Similar Stocks
Dashboard
Poor long term growth as Net Sales has grown by an annual rate of 11.35% and Operating profit at 3.22% over the last 5 years
Flat results in Mar 26
With ROE of 7.4, it has a Very Expensive valuation with a 3.7 Price to Book Value
Consistent Underperformance against the benchmark over the last 3 years
Stock DNA
Healthcare Services
INR 17,780 Cr (Small Cap)
50.00
34
0.27%
-0.17
7.41%
3.67
Total Returns (Price + Dividend) 
Latest dividend: 1.2 per share ex-dividend date: Jun-27-2025
Risk Adjusted Returns v/s
Returns Beta

News

Syngene International Ltd is Rated Sell
Syngene International Ltd is rated 'Sell' by MarketsMOJO, with this rating last updated on 16 April 2026. However, the analysis and financial metrics discussed here reflect the stock's current position as of 11 June 2026, providing investors with an up-to-date view of its fundamentals, returns, and market standing.
Read full news article
Syngene International Ltd is Rated Sell
Syngene International Ltd is rated 'Sell' by MarketsMOJO, with this rating last updated on 16 Apr 2026. However, the analysis and financial metrics discussed here reflect the stock's current position as of 31 May 2026, providing investors with an up-to-date view of the company’s fundamentals, returns, and market standing.
Read full news article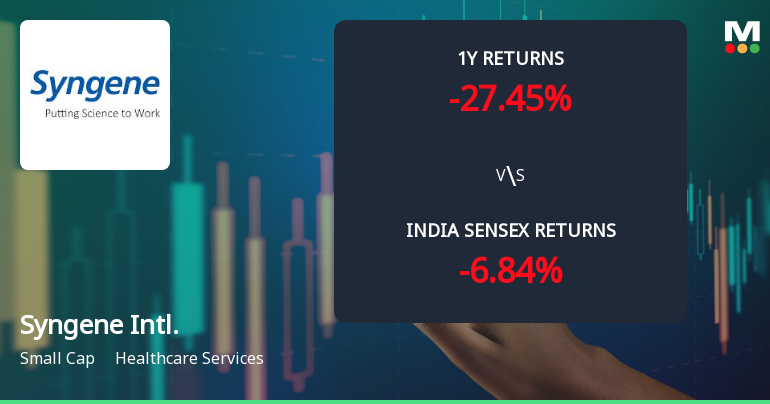
Syngene International Ltd Technical Analysis Reveals Mixed Momentum Amid Bearish Shift
Syngene International Ltd, a small-cap player in the Healthcare Services sector, is currently navigating a complex technical landscape marked by a shift from sideways to mildly bearish momentum. Despite some bullish weekly indicators, monthly signals remain subdued, reflecting a cautious outlook for investors amid recent price declines and underperformance relative to benchmarks.
Read full news article Announcements
Syngene International Limited - Analysts/Institutional Investor Meet/Con. Call Updates
09-Dec-2019 | Source : NSESyngene International Limited has informed the Exchange regarding Analysts/Institutional Investor Meet/Con. Call Updates
Syngene International Limited - Analysts/Institutional Investor Meet/Con. Call Updates
27-Nov-2019 | Source : NSESyngene International Limited has informed the Exchange regarding Analysts/Institutional Investor Meet/Con. Call Updates
Syngene International Limited - Analysts/Institutional Investor Meet/Con. Call Updates
26-Nov-2019 | Source : NSESyngene International Limited has informed the Exchange regarding Analysts/Institutional Investor Meet/Con. Call Updates
Corporate Actions

No Upcoming Board Meetings

Syngene International Ltd has declared 12% dividend, ex-date: 25 Jun 26

No Splits history available

Syngene International Ltd has announced 1:1 bonus issue, ex-date: 11 Jun 19

No Rights history available
Quality key factors
Valuation key factors
Technicals key factors
 Technical Indicator Scale: Bearish, Mildly Bearish, Sideways, Mildly Bullish, Bullish Turned
 Shareholding Snapshot : Mar 2026
Shareholding Compare (%holding)
Promoters
None
Held by 25 Schemes (24.18%)
Held by 188 FIIs (13.9%)
Biocon Limited (52.41%)
Nippon Life India Trustee Ltd-a/c Nippon India Ret (5.99%)
5.51%
Quarterly Results Snapshot (Consolidated) - Mar'26 - QoQ

QoQ Growth in quarter ended Mar 2026 is 13.02% vs 0.71% in Dec 2025
QoQ Growth in quarter ended Mar 2026 is 886.00% vs -77.65% in Dec 2025
Half Yearly Results Snapshot (Consolidated) - Sep'25
Growth in half year ended Sep 2025 is 6.21% vs -2.18% in Sep 2024

Growth in half year ended Sep 2025 is -15.40% vs -13.39% in Sep 2024
Nine Monthly Results Snapshot (Consolidated) - Dec'25
YoY Growth in nine months ended Dec 2025 is 2.96% vs 2.05% in Dec 2024
YoY Growth in nine months ended Dec 2025 is -46.05% vs -2.64% in Dec 2024
Annual Results Snapshot (Consolidated) - Mar'26
YoY Growth in year ended Mar 2026 is 2.64% vs 4.41% in Mar 2025
YoY Growth in year ended Mar 2026 is -36.17% vs -2.71% in Mar 2025
About Syngene International Ltd

Company Coordinates


