
Compare Synoptics Techno with Similar Stocks
Dashboard
Weak Long Term Fundamental Strength with a -1.54% CAGR growth in Operating Profits over the last 5 years
- The company has been able to generate a Return on Equity (avg) of 5.55% signifying low profitability per unit of shareholders funds
Flat results in Sep 24
Below par performance in long term as well as near term
Total Returns (Price + Dividend) 
Synoptics Techno for the last several years.
Risk Adjusted Returns v/s
Returns Beta

News

Synoptics Technologies Ltd Locks at Lower Circuit With 5.0% Loss — Sellers Queue, No Buyers in Sight
At Rs 72.20, Synoptics Technologies Ltd locked at its lower circuit on 15 Jul 2026, marking a 5.0% decline within the 5% price band. The session was characterised by persistent selling interest with no buyers willing to absorb the supply, resulting in unfilled sell orders and a frozen price.
Read full news article
Synoptics Technologies Ltd Locks at Lower Circuit With 4.94% Loss — Sellers Queue, No Buyers in Sight
At Rs 74.05, sellers were still queuing — but there were no buyers willing to take the other side. Synoptics Technologies Ltd locked at its lower circuit of 4.94% on 15 Jul 2026, with unfilled sell orders and a frozen price, reflecting a constrained exit environment for shareholders.
Read full news article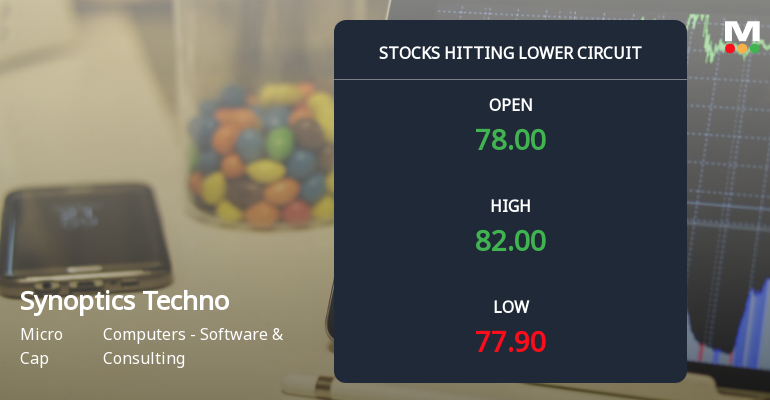
Synoptics Technologies Ltd Locks at Lower Circuit With 5.0% Loss — Sellers Queue, No Buyers in Sight
At Rs 77.9, sellers were still queuing — but there were no buyers willing to take the other side. Synoptics Technologies Ltd locked at its lower circuit of 5.0% on 14 Jul 2026, with unfilled sell orders and a frozen price.
Read full news article Announcements
Corporate Actions

No Upcoming Board Meetings

No Dividend history available

No Splits history available

No Bonus history available

No Rights history available
Quality key factors
Valuation key factors
Technicals key factors
 Technical Indicator Scale: Bearish, Mildly Bearish, Sideways, Mildly Bullish, Bullish Turned
 Shareholding Snapshot : Mar 2026
Shareholding Compare (%holding)
Promoters
None
Held by 0 Schemes
Held by 0 FIIs
Jatin Jagmohan Shah (67.69%)
None
23.79%
Half Yearly Results Snapshot (Consolidated) - Mar'26

Growth in half year ended Mar 2026 is -7.52% vs 50.69% in Sep 2025
Growth in half year ended Mar 2026 is -79.71% vs 486.21% in Sep 2025
Nine Monthly Results Snapshot (Consolidated) - Sep'24

YoY Growth in nine months ended Sep 2024 is 7.12% vs 4.94% in Sep 2024
YoY Growth in nine months ended Sep 2024 is 3.94% vs -6.12% in Sep 2024
Annual Results Snapshot (Consolidated) - Mar'26
YoY Growth in year ended Mar 2026 is 31.85% vs 0.07% in Mar 2025
YoY Growth in year ended Mar 2026 is 1.24% vs -32.78% in Mar 2025
About Synoptics Technologies Ltd

Company Coordinates


