
Compare Syrma SGS Tech. with Similar Stocks
Dashboard
Strong ability to service debt as the company has a low Debt to EBITDA ratio of 0.75 times
Healthy long term growth as Net Sales has grown by an annual rate of 33.00% and Operating profit at 43.61%
With a growth in Net Sales of 15.89%, the company declared Very Positive results in Mar 26
High Institutional Holdings at 23.21%
Company is among the highest 1% of companies rated by MarketsMojo across all 4,000 stocks
Market Beating performance in long term as well as near term
Stock DNA
Industrial Manufacturing
INR 26,535 Cr (Small Cap)
83.00
55
0.11%
-0.14
11.23%
9.01
Total Returns (Price + Dividend) 
Latest dividend: 1.4914414414414414 per share ex-dividend date: Sep-19-2025
Risk Adjusted Returns v/s
Returns Beta

News
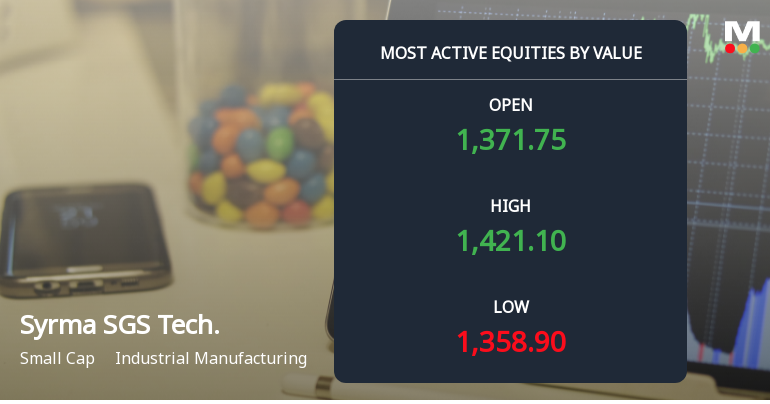
Syrma SGS Technology Ltd Surges on High-Value Trading and Institutional Interest
Syrma SGS Technology Ltd (SYRMA) has emerged as one of the most actively traded stocks by value on 23 June 2026, hitting a new 52-week and all-time high of Rs 1,422. The industrial manufacturing company’s shares have gained 3.36% intraday, buoyed by strong institutional interest and robust order flow, outperforming its sector and broader market indices significantly.
Read full news article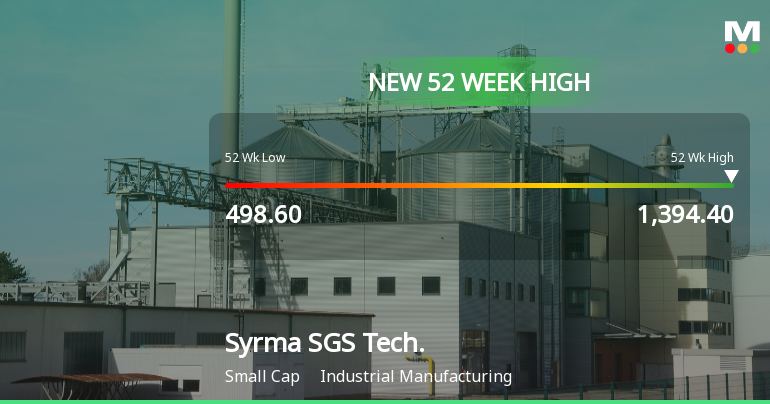
Broad-Based Technical Strength Lifts Syrma SGS Technology Ltd to 52-Week High of Rs 1394.4
With a remarkable surge to Rs 1394.4 on 23 Jun 2026, Syrma SGS Technology Ltd has reached a fresh 52-week and all-time high, extending its impressive rally that has delivered a 172.20% return over the past year, vastly outperforming the Sensex’s decline of 5.78% in the same period.
Read full news article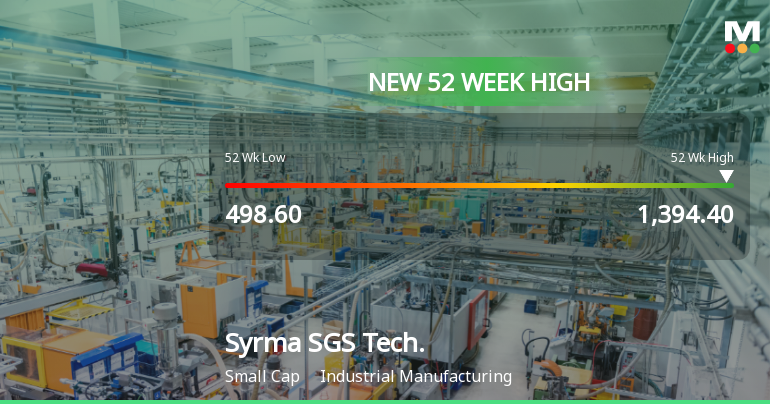
Broad-Based Technical Strength Lifts Syrma SGS Technology Ltd to 52-Week High of Rs 1394.4
Surging to an all-time high of Rs 1394.4 on 23 Jun 2026, Syrma SGS Technology Ltd has demonstrated remarkable price momentum, outpacing its sector and the broader market with a 172.20% gain over the past year. This milestone caps a sustained rally fuelled by a confluence of technical indicators signalling robust upward momentum.
Read full news article Announcements
Announcement under Regulation 30 (LODR)-Joint Venture
22-Jun-2026 | Source : BSEAgreement between Syrma SGS Technology Limited (Company) and Kaga Electronics India Private Limited (Kaga)
Announcement under Regulation 30 (LODR)-Investor Presentation
07-Jun-2026 | Source : BSEIntimation under Regulation 30 of SEBI (Listing Obligations and Disclosure Requirements) Regulations 2025 - Investor Presentation
Announcement under Regulation 30 (LODR)-Analyst / Investor Meet - Intimation
25-May-2026 | Source : BSEIntimation under Regulation 30 of Securities and Exchange Board of India (Listing Obligations and Disclosure Requirements) Regulations 2015 (the Listing Regulations) for participating in Investor Meetings
Corporate Actions

No Upcoming Board Meetings

Syrma SGS Technology Ltd has declared 15% dividend, ex-date: 19 Sep 25

No Splits history available

No Bonus history available

No Rights history available
Quality key factors
Valuation key factors
Technicals key factors
 Technical Indicator Scale: Bearish, Mildly Bearish, Sideways, Mildly Bullish, Bullish Turned
 Shareholding Snapshot : Mar 2026
Shareholding Compare (%holding)
Promoters
None
Held by 27 Schemes (9.74%)
Held by 109 FIIs (6.61%)
Tancom Electronics Private Limited (32.84%)
Krishna Kumar Pant (6.35%)
30.93%
Quarterly Results Snapshot (Consolidated) - Mar'26 - QoQ

QoQ Growth in quarter ended Mar 2026 is 15.89% vs 10.32% in Dec 2025

QoQ Growth in quarter ended Mar 2026 is -1.56% vs 60.46% in Dec 2025
Half Yearly Results Snapshot (Consolidated) - Sep'25
Growth in half year ended Sep 2025 is 5.04% vs 51.76% in Sep 2024
Growth in half year ended Sep 2025 is 104.93% vs -2.36% in Sep 2024
Nine Monthly Results Snapshot (Consolidated) - Dec'25
YoY Growth in nine months ended Dec 2025 is 17.29% vs 41.72% in Dec 2024
YoY Growth in nine months ended Dec 2025 is 107.62% vs 44.11% in Dec 2024
Annual Results Snapshot (Consolidated) - Mar'26
YoY Growth in year ended Mar 2026 is 27.26% vs 19.42% in Mar 2025
YoY Growth in year ended Mar 2026 is 87.07% vs 58.27% in Mar 2025
About Syrma SGS Technology Ltd

Company Coordinates


