Syschem (India)

  • Market Cap: Micro Cap
  • Industry: Pharmaceuticals & Biotechnology
  • ISIN: INE121D01036
  • NSEID:
  • BSEID: 531173
INR
30.87
-0.2 (-0.64%)
BSENSE

Aug 19, 12:47 PM

BSE+NSE Vol: 40.97 k

  • Price Points
  • Score
  • Mojo Parameters
  • Total Return
  • News and Corporate Actions
  • Key factors
  • Shareholding
  • Financials
  • CompanyCV
stock-summaryPrice Point
High/Low

1Day

52 Week

Valuation
Technical
Day's Volume

CASH

40.97 k (61.44%) Volume

Shareholding (Jul 2026)

FII

0.00%

Held by 0 FIIs

DII

0.15%

Held by 0 DIIs

Promoter

63.38%

Why is Syschem (India) Ltd falling/rising?

19-Aug-2026

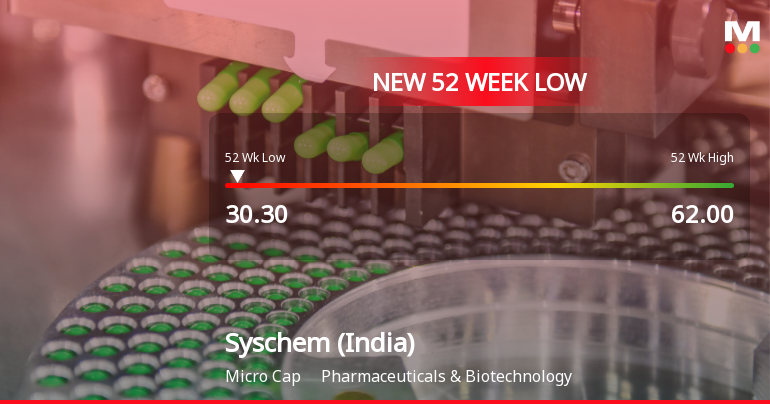
As of 18-Aug, Syschem (India) Ltd's stock price is declining, currently at Rs 31.07, reflecting a bearish trend with significant investor disinterest and proximity to its 52-week low. The stock has lost value for two consecutive days and is trading below its moving averages.

As of 18-Aug, Syschem (India) Ltd's stock price is falling, currently at Rs 31.07, which reflects a decrease of Rs 0.48 or 1.52%. The stock has been underperforming, having lost value for the last two consecutive days, with a total decline of 2.14% during this period. Additionally, the stock is trading below its moving averages across various time frames, including the 5-day, 20-day, 50-day, 100-day, and 200-day averages, indicating a bearish trend.<BR><BR>Investor participation has also decreased significantly, with delivery volume dropping by 73.68% compared to the 5-day average, suggesting reduced interest from investors. Furthermore, the stock is close to its 52-week low, being only 2% away from the low of Rs 30.45. Overall, these factors contribute to the downward pressure on Syschem (India) Ltd's stock price.

View full answer

Who are in the management team of Syschem (India)?

14-Aug-2026

The management team of Syschem (India) includes Ranjan Jain (Executive Director & Managing Director), Suninder Veer Singh (Executive Director & Wholetime Director), Arshdeep Kaur (Independent Non-Executive Director), Neena Batra (Non-Executive & Non-Independent Director), and Renu Rawat (Independent Non-Executive Director).

The management team of Syschem (India) includes the following members:<BR><BR>1. Ranjan Jain - Executive Director & Managing Director<BR>2. Suninder Veer Singh - Executive Director & Wholetime Director<BR>3. Arshdeep Kaur - Independent Non-Executive Director<BR>4. Neena Batra - Non-Executive & Non-Independent Director<BR>5. Renu Rawat - Independent Non-Executive Director<BR><BR>If you need more information about any specific member or their roles, feel free to ask!

View full answer

What does Syschem (India) do?

14-Aug-2026

Syschem (India) Ltd manufactures Active Pharmaceutical Ingredients (API) and intermediates in the Pharmaceuticals & Biotechnology sector. As of June 2026, it reported net sales of 109 Cr and a net profit of -2 Cr, with a market cap of INR 156 Cr.

Overview:<BR>Syschem (India) Ltd is engaged in the manufacturing of Active Pharmaceutical Ingredients (API) and intermediates, operating within the Pharmaceuticals & Biotechnology industry and categorized as a Micro Cap company.<BR><BR>History:<BR>The company was incorporated on 31 December 1993 and was formerly known as Anil Pesticides Limited until it changed its name to Syschem (India) Limited on February 17, 2003. The latest quarterly results reported net sales and profit for June 2026.<BR><BR>Financial Snapshot:<BR>- Net Sales: 109 Cr (Quarterly Results - Jun 2026)<BR>- Net Profit: -2 Cr (Quarterly Results - Jun 2026)<BR>- Market Cap: INR 156 Cr (Micro Cap)<BR><BR>Key Metrics:<BR>- P/E: 25.00<BR>- Industry P/E: 44<BR>- Dividend Yield: 0.00%<BR>- Debt Equity: -0.05<BR>- Return on Equity: 6.47%<BR>- Price to Book: 1.61<BR><BR>Contact Details:<BR>- Address: Tehsil Kalka, Bargodam Village Panchkula Haryana : 133302<BR>- Tel: 91-172-3077777<BR>- Email: info@syschem.in<BR>- Website: http://www.syschem.in

View full answer

Who are the peers of the Syschem (India)?

14-Aug-2026

Syschem (India) peers include Achyut Healthcar, Natural Capsules, Panch.Organics, Parnax Lab, Auro Labs, Smruthi Organic, Bal Pharma, and Quest Laborato. Syschem shows good growth and capital structure but has a 1-year return of -33.66%, lower than its peers.

Peers: The peers of Syschem (India) are Achyut Healthcar, Natural Capsules, Panch.Organics, Parnax Lab, Auro Labs., Smruthi Organic, Bal Pharma, and Quest Laborato.<BR><BR>Quality Snapshot: Below Average management risk is observed at Achyut Healthcar, Natural Capsules, Syschem (India), and the rest. Average management risk is found at Panch.Organics, Auro Labs., Smruthi Organic, Bal Pharma, and the rest. Good growth is noted at Syschem (India), Parnax Lab, while Average growth is seen at Achyut Healthcar, and the rest, with Below Average growth at Natural Capsules, Panch.Organics, Auro Labs., Smruthi Organic, Bal Pharma, and the rest. Good capital structure is present at Syschem (India), while Excellent capital structure is noted at Panch.Organics, Parnax Lab, and the rest, with Below Average capital structure at Natural Capsules, Auro Labs., Bal Pharma, and the rest.<BR><BR>Return Snapshot: The peer with the highest 1-year return is Guj. Inject(Ker) at 469.95%, while Natural Capsules has the lowest at -28.67%. Syschem (India) has a 1-year return of -33.66%, which is lower than both of these peers. Additionally, Natural Capsules, Syschem (India), Auro Labs., and Bal Pharma have negative six-month returns.

View full answer

How big is Syschem (India)?

14-Aug-2026

As of 14th August, Syschem (India) Ltd has a market capitalization of 155.00 Cr, with recent net sales of 573.66 Cr and a net profit of 6.14 Cr. The balance sheet for March 2025 shows shareholder's funds of 91.29 Cr and total assets of 216.87 Cr.

As of 14th August, Syschem (India) Ltd has a market capitalization of 155.00 Cr, categorizing it as a Micro Cap company.<BR><BR>In the latest four quarters, Syschem (India) reported Net Sales of 573.66 Cr and a Net Profit of 6.14 Cr.<BR><BR>The latest annual period for the balance sheet is March 2025, showing Shareholder's Funds of 91.29 Cr and Total Assets of 216.87 Cr.

View full answer

Are Syschem (India) Ltd latest results good or bad?

05-Aug-2026

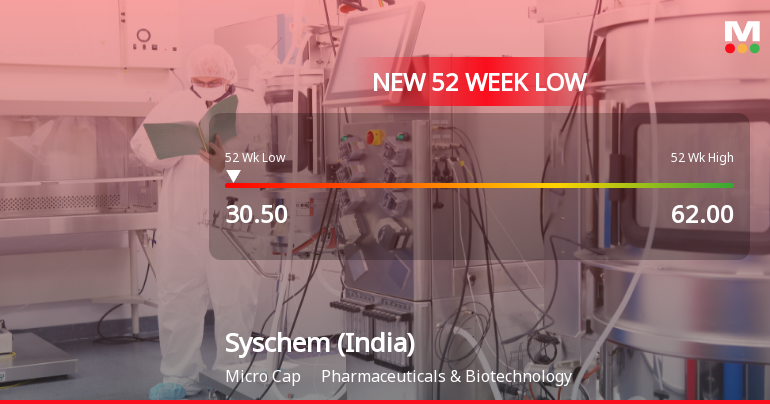
Syschem (India) Ltd's latest Q1 FY27 results are concerning, showing a net loss of ₹1.67 crores and a significant decline in operating margin to 0.50%, leading to a nearly 20% drop in stock price. This indicates serious operational challenges and underperformance compared to industry peers.

Syschem (India) Ltd's latest results for Q1 FY27 are concerning and can be classified as bad. The company reported a net loss of ₹1.67 crores, which marks a significant decline of 200% year-on-year. Revenue remained relatively flat at ₹109.21 crores, showing only a slight decrease of 0.10% compared to the previous year, but it experienced a dramatic 50.21% drop from the preceding quarter.<BR><BR>The operating margin has also plummeted to just 0.50%, the lowest level in eight quarters, indicating severe operational challenges. This margin compression, coupled with rising costs—particularly a 111.52% increase in employee expenses—has pressured profitability significantly. The market reacted negatively, with the stock price falling by nearly 20% in a single day, hitting a 52-week low.<BR><BR>Overall, the combination of a quarterly loss, collapsing margins, and significant underperformance compared to industry peers suggests that Syschem is facing serious operational difficulties that need urgent attention.

View full answer

When is the next results date for Syschem (India) Ltd?

23-Jul-2026

The next results date for Syschem (India) Ltd is August 4, 2026.

The next results date for Syschem (India) Ltd is scheduled for August 4, 2026.

View full answer

Should I buy, sell or hold Syschem (India) Ltd?

15-May-2026

How has been the historical performance of Syschem (India)?

12-Nov-2025

Syschem (India) has shown significant sales growth, increasing from 59.00 Cr in Mar'22 to 331.68 Cr in Mar'25, but profitability has declined, with profit after tax dropping from 4.51 Cr in Mar'23 to 0.46 Cr in Mar'25, and cash flow from operations remains negative. Total assets and liabilities grew in tandem, indicating financial challenges despite overall growth.

Answer:<BR>The historical performance of Syschem (India) shows significant fluctuations in key financial metrics over the years, particularly in net sales, operating profit, and profit after tax.<BR><BR>Breakdown:<BR>Syschem (India) has experienced a notable increase in net sales, rising from 59.00 Cr in Mar'22 to 331.68 Cr in Mar'25, reflecting a strong growth trajectory. Total operating income followed a similar trend, reaching 331.68 Cr in Mar'25, up from 59.00 Cr in Mar'22. However, the company's total expenditure also increased significantly, from 58.44 Cr in Mar'22 to 327.69 Cr in Mar'25, primarily driven by rising raw material costs, which surged from 46.97 Cr in Mar'22 to 310.87 Cr in Mar'25. Operating profit (PBDIT) showed volatility, peaking at 8.90 Cr in Mar'23 but dropping to 4.03 Cr in Mar'25. Profit before tax also fluctuated, with a high of 6.15 Cr in Mar'23 and a decline to 1.01 Cr in Mar'25. Profit after tax mirrored this trend, decreasing from 4.51 Cr in Mar'23 to 0.46 Cr in Mar'25. The company's total assets grew from 55.87 Cr in Mar'22 to 216.87 Cr in Mar'25, while total liabilities increased from 55.87 Cr to 216.87 Cr in the same period. Cash flow from operating activities remained negative, indicating ongoing challenges in generating cash from core operations, although cash flow from financing activities showed improvement, contributing to a net cash inflow of 2.00 Cr in Mar'25. Overall, Syschem (India) has shown growth in sales and assets, but profitability and cash flow remain areas of concern.

View full answer

Is Syschem (India) overvalued or undervalued?

07-Aug-2025

As of August 6, 2025, Syschem (India) is considered very expensive with a PE ratio of 100.12 and low ROCE and ROE, indicating it is overvalued at its current price of 45.79 despite a recent positive stock performance.

As of 6 August 2025, the valuation grade for Syschem (India) has moved from expensive to very expensive. The company is currently overvalued, with a PE ratio of 100.12, an EV to EBITDA of 34.95, and a PEG ratio of 2.03. In comparison, peers such as Solar Industries and Gujarat Fluoroch are also categorized as very expensive, with PE ratios of 112.38 and 64.46, respectively, highlighting that Syschem's valuation is not an outlier in the industry but remains significantly high.<BR><BR>Despite the recent stock performance showing a 3.93% return over the past week compared to a -1.15% return for the Sensex, the overall valuation metrics indicate that Syschem (India) is not justified at its current price of 45.79. The low ROCE of 1.16% and ROE of 2.18% further emphasize the disconnect between its market price and fundamental performance, reinforcing the conclusion that the stock is overvalued.

View full answer

Who are the top shareholders of the Syschem (India)?

17-Jul-2025

The top shareholders of Syschem (India) include promoter Virendra Popatlal Shah with 10.43%, and Ashika Global Finance Private Limited as the largest public shareholder at 4.44%. Individual investors hold a combined 33.37%, with no pledged promoter holdings or mutual funds/foreign institutional investors involved.

The top shareholders of Syschem (India) include the promoters, with Virendra Popatlal Shah holding the highest individual stake at 10.43%. In terms of public shareholders, Ashika Global Finance Private Limited is the largest, owning 4.44%. Additionally, individual investors collectively hold 33.37% of the company's shares. Notably, there are no pledged promoter holdings, and the company does not have any mutual funds or foreign institutional investors (FIIs) holding shares.

View full answer

What is the technical trend for Syschem (India)?

09-Jun-2025

As of May 12, 2025, Syschem (India) shows a mildly bearish trend with mixed signals from key indicators, including a mildly bullish weekly MACD and a mildly bearish monthly MACD, suggesting a lack of strong momentum.

As of 12 May 2025, the technical trend for Syschem (India) has changed from bearish to mildly bearish. The weekly MACD is mildly bullish, while the monthly MACD is mildly bearish, indicating mixed signals. The Bollinger Bands show a bullish stance on the weekly chart but are mildly bearish on the monthly chart. Moving averages on the daily timeframe are mildly bearish, suggesting short-term weakness. The KST is mildly bullish on the weekly and mildly bearish on the monthly, further contributing to the mixed outlook. Overall, the current technical stance is mildly bearish, with key indicators reflecting a lack of strong momentum in either direction.

View full answer

Has Syschem (India) declared dividend?

06-Jun-2025

No Dividend History Available

iScoreScore
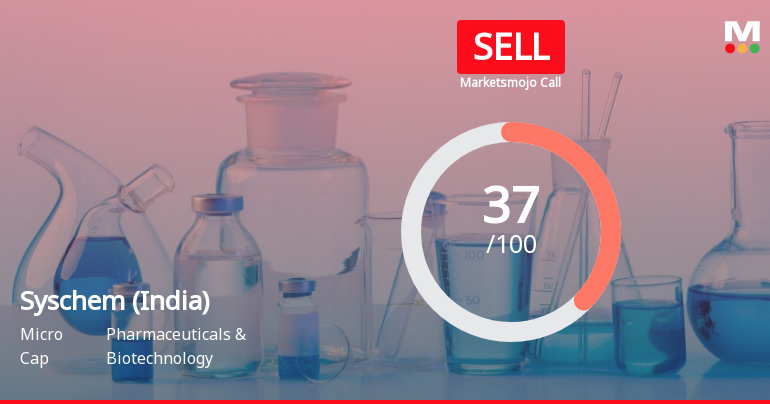
Click here to find our call on this stock
Strong Sell
Sell
Hold
Buy
Strong Buy

Dashboard

1

Poor Management Efficiency with a low ROE of 8.92%

  • The company has been able to generate a Return on Equity (avg) of 8.92% signifying low profitability per unit of shareholders funds
2

Flat results in Jun 26

3

Below par performance in long term as well as near term

stock-summaryMojo Parameters

Mojo Parameters

Loading Valuation Snapshot...

Stock DNA

stock-summary
Industry

Pharmaceuticals & Biotechnology

stock-summary
Market cap

INR 166 Cr (Micro Cap)

stock-summary
P/E

25.00

stock-summary
Industry P/E

43

stock-summary
Dividend Yield

0.00%

stock-summary
Debt Equity

-0.05

stock-summary
Return on Equity

6.47%

stock-summary
Price to Book

1.61

Revenue and Profits:
Net Sales:
109 Cr
(Quarterly Results - Jun 2026)
Net Profit:
-2 Cr
stock-summaryTotal Returns
Total Returns (Price + Dividend) stock-summary
Dividend Yield (0%)
TimePeriod
Price Return
Dividend Return
Total Return
3 Months
-37.64%
0%
-37.64%
6 Months
-39.75%
0%
-39.75%
1 Year
-33.61%
0%
-33.61%
2 Years
-33.04%
0%
-33.04%
3 Years
-29.08%
0%
-29.08%
4 Years
-11.19%
0%
-11.19%
5 Years
286.36%
0%
286.36%

Syschem (India) for the last several years.

Risk Adjusted Returns v/s stock-summary
Returns Beta
Icon
Beta has not been calculated since enough price history is not available
stock-summaryNews & Corporate Actions

Announcements stock-summary

General Update_ Clarification On Investor Presentation

10-Aug-2026 | Source : BSE

Clarification on Investor Presentation

Investor Presentation

08-Aug-2026 | Source : BSE

Investor Presentation

Newspaper Advertisements

06-Aug-2026 | Source : BSE

As per Reg 47 of SEBI (Listing Obligations and Disclosure Requirements) 2015

Corporate Actions stock-summary

stock-summary
BOARD MEETING

No Upcoming Board Meetings

stock-summary
DIVIDEND

No Dividend history available

stock-summary
SPLITS

Syschem (India) Ltd has announced 10:1 stock split, ex-date: 12 Dec 14

stock-summary
BONUS

No Bonus history available

stock-summary
RIGHTS

Syschem (India) Ltd has announced 1:4 rights issue, ex-date: 28 Sep 23

stock-summaryKey Factors

Quality key factors stock-summary

Factor
Value
Sales Growth (5y)
50.14%
EBIT Growth (5y)
29.75%
EBIT to Interest (avg)
3.52
Debt to EBITDA (avg)
Negative Net Debt
Net Debt to Equity (avg)
-0.05
Sales to Capital Employed (avg)
4.32
Tax Ratio
47.30%
Dividend Payout Ratio
0
Pledged Shares
0
Institutional Holding
0.15%
ROCE (avg)
-3.19%
ROE (avg)
8.92%

Valuation key factors

Factor
Value
P/E Ratio
25
Industry P/E
43
Price to Book Value
1.61
EV to EBIT
10.39
EV to EBITDA
7.75
EV to Capital Employed
1.64
EV to Sales
0.26
PEG Ratio
0.14
Dividend Yield
NA
ROCE (Latest)
6.37%
ROE (Latest)
6.47%

Technicals key factors

Indicator
Weekly
Monthly
MACD
Bearish
Bearish
RSI
No Signal
No Signal
Bollinger Bands
Bearish
Bearish
Moving Averages
Bearish (Daily)
KST
Bearish
Bearish
Dow Theory
No Trend
Mildly Bearish
stock-summary Technical Indicator Scale: Bearish, Mildly Bearish, Sideways, Mildly Bullish, Bullish  Turned 
stock-summaryShareholding
Shareholding Snapshot : Jul 2026stock-summary
Shareholding Compare (%holding) stock-summary
Majority shareholders

Promoters

Pledged Promoter Holdings

None

Mutual Funds

Held by 0 Schemes

FIIs

Held by 0 FIIs

Promoter with highest holding

Virendra Popatlal Shah (11.05%)

Highest Public shareholder

Ashika Global Finance Pvt. Ltd. (4.43%)

Individual Investors Holdings

27.85%

stock-summaryFinancial
[
  {
    "link": "quarterly",
    "btn_text": "All Quarterly Results",
    "header": "Quarterly Results Snapshot (Standalone) - Jun'26 - YoY",
    "rhs": [
      {
        "prefix": "Net Sales ",
        "suffix": "YoY Growth in quarter ended Jun 2026 is -0.10% vs 24.89% in Jun 2025",
        "dir": -1
      },
      {
        "prefix": "Standalone Net Profit ",
        "suffix": "YoY Growth in quarter ended Jun 2026 is -200.00% vs 1,092.86% in Jun 2025",
        "dir": -1
      }
    ],
    "table": {
      "header": [
        "Jun'26",
        "Jun'25",
        "Change(%)"
      ],
      "body": [
        {
          "field": "Net Sales",
          "val1": "109.21",
          "val2": "109.32",
          "chgp": "-0.10%",
          "chgp_class": "negative"
        },
        {
          "field": "Operating Profit (PBDIT) excl Other Income",
          "val1": "0.55",
          "val2": "2.47",
          "chgp": "-77.73%",
          "chgp_class": "negative"
        },
        {
          "field": "Interest",
          "val1": "0.49",
          "val2": "0.04",
          "chgp": "1,125.00%",
          "chgp_class": "negative"
        },
        {
          "field": "Exceptional Items",
          "val1": "0.00",
          "val2": "0.00",
          "chgp": "",
          "chgp_class": "neutral"
        },
        {
          "field": "Standalone Net Profit",
          "val1": "-1.67",
          "val2": "1.67",
          "chgp": "-200.00%",
          "chgp_class": "negative"
        },
        {
          "field": "Operating Profit Margin (Excl OI)",
          "val1": "0.50%",
          "val2": "2.26%",
          "chgp": "-1.76%",
          "chgp_class": "negative"
        }
      ]
    }
  },
  {
    "link": "half-yearly",
    "btn_text": "All Half Yearly Results",
    "header": "Half Yearly Results Snapshot (Standalone) - Mar'26",
    "rhs": [
      {
        "prefix": "Net Sales ",
        "suffix": " Growth in half year ended Mar 2026 is 66.45% vs 0.05% in Sep 2025",
        "dir": 1
      },
      {
        "prefix": "Standalone Net Profit ",
        "suffix": " Growth in half year ended Mar 2026 is 116.81% vs 0.00% in Sep 2025",
        "dir": 1
      }
    ],
    "table": {
      "header": [
        "Mar'26",
        "Sep'25",
        "Change(%)"
      ],
      "body": [
        {
          "field": "Net Sales",
          "val1": "354.41",
          "val2": "212.92",
          "chgp": "66.45%",
          "chgp_class": "positive"
        },
        {
          "field": "Operating Profit (PBDIT) excl Other Income",
          "val1": "11.73",
          "val2": "5.77",
          "chgp": "103.29%",
          "chgp_class": "positive"
        },
        {
          "field": "Interest",
          "val1": "0.22",
          "val2": "0.05",
          "chgp": "340.00%",
          "chgp_class": "negative"
        },
        {
          "field": "Exceptional Items",
          "val1": "0.00",
          "val2": "0.00",
          "chgp": "",
          "chgp_class": "neutral"
        },
        {
          "field": "Standalone Net Profit",
          "val1": "7.74",
          "val2": "3.57",
          "chgp": "116.81%",
          "chgp_class": "positive"
        },
        {
          "field": "Operating Profit Margin (Excl OI)",
          "val1": "3.31%",
          "val2": "2.71%",
          "chgp": "0.60%",
          "chgp_class": "positive"
        }
      ]
    }
  },
  {
    "link": "nine-monthly",
    "btn_text": "All Nine Monthly Results",
    "header": "Nine Monthly Results Snapshot (Standalone) - Dec'25",
    "rhs": [
      {
        "prefix": "Net Sales ",
        "suffix": "YoY Growth in nine months ended Dec 2025 is 66.54% vs 71.69% in Dec 2024",
        "dir": -1
      },
      {
        "prefix": "Standalone Net Profit ",
        "suffix": "YoY Growth in nine months ended Dec 2025 is 0.00% vs -100.00% in Dec 2024",
        "dir": 1
      }
    ],
    "table": {
      "header": [
        "Dec'25",
        "Dec'24",
        "Change(%)"
      ],
      "body": [
        {
          "field": "Net Sales",
          "val1": "354.42",
          "val2": "212.81",
          "chgp": "66.54%",
          "chgp_class": "positive"
        },
        {
          "field": "Operating Profit (PBDIT) excl Other Income",
          "val1": "11.73",
          "val2": "2.08",
          "chgp": "463.94%",
          "chgp_class": "positive"
        },
        {
          "field": "Interest",
          "val1": "0.22",
          "val2": "0.07",
          "chgp": "214.29%",
          "chgp_class": "negative"
        },
        {
          "field": "Exceptional Items",
          "val1": "0.00",
          "val2": "0.00",
          "chgp": "",
          "chgp_class": "neutral"
        },
        {
          "field": "Standalone Net Profit",
          "val1": "7.74",
          "val2": "0.00",
          "chgp": "",
          "chgp_class": "neutral"
        },
        {
          "field": "Operating Profit Margin (Excl OI)",
          "val1": "3.31%",
          "val2": "0.98%",
          "chgp": "2.33%",
          "chgp_class": "positive"
        }
      ]
    }
  },
  {
    "link": "annual",
    "btn_text": "All Annual Results",
    "header": "Annual Results Snapshot (Standalone) - Mar'26",
    "rhs": [
      {
        "prefix": "Net Sales ",
        "suffix": "YoY Growth in year ended Mar 2026 is 72.99% vs 66.96% in Mar 2025",
        "dir": 1
      },
      {
        "prefix": "Standalone Net Profit ",
        "suffix": "YoY Growth in year ended Mar 2026 is 2,276.09% vs -83.33% in Mar 2025",
        "dir": 1
      }
    ],
    "table": {
      "header": [
        "Mar'26",
        "Mar'25",
        "Change(%)"
      ],
      "body": [
        {
          "field": "Net Sales",
          "val1": "573.77",
          "val2": "331.68",
          "chgp": "72.99%",
          "chgp_class": "positive"
        },
        {
          "field": "Operating Profit (PBDIT) excl Other Income",
          "val1": "21.09",
          "val2": "3.99",
          "chgp": "428.57%",
          "chgp_class": "positive"
        },
        {
          "field": "Interest",
          "val1": "2.26",
          "val2": "0.07",
          "chgp": "3,128.57%",
          "chgp_class": "negative"
        },
        {
          "field": "Exceptional Items",
          "val1": "0.00",
          "val2": "0.00",
          "chgp": "",
          "chgp_class": "neutral"
        },
        {
          "field": "Standalone Net Profit",
          "val1": "10.93",
          "val2": "0.46",
          "chgp": "2,276.09%",
          "chgp_class": "positive"
        },
        {
          "field": "Operating Profit Margin (Excl OI)",
          "val1": "3.68%",
          "val2": "1.20%",
          "chgp": "2.48%",
          "chgp_class": "positive"
        }
      ]
    }
  }
]

Quarterly Results Snapshot (Standalone) - Jun'26 - YoYstock-summary

Jun'26
Jun'25
Change(%)
Net Sales
109.21
109.32
-0.10%
Operating Profit (PBDIT) excl Other Income
0.55
2.47
-77.73%
Interest
0.49
0.04
1,125.00%
Exceptional Items
0.00
0.00
Standalone Net Profit
-1.67
1.67
-200.00%
Operating Profit Margin (Excl OI)
0.50%
2.26%
-1.76%
Values in Rs Cr.
Direction Arrows
Net Sales

YoY Growth in quarter ended Jun 2026 is -0.10% vs 24.89% in Jun 2025

Direction Arrows
Standalone Net Profit

YoY Growth in quarter ended Jun 2026 is -200.00% vs 1,092.86% in Jun 2025

Half Yearly Results Snapshot (Standalone) - Mar'26stock-summary

Mar'26
Sep'25
Change(%)
Net Sales
354.41
212.92
66.45%
Operating Profit (PBDIT) excl Other Income
11.73
5.77
103.29%
Interest
0.22
0.05
340.00%
Exceptional Items
0.00
0.00
Standalone Net Profit
7.74
3.57
116.81%
Operating Profit Margin (Excl OI)
3.31%
2.71%
0.60%
Values in Rs Cr.
Direction Arrows
Net Sales

Growth in half year ended Mar 2026 is 66.45% vs 0.05% in Sep 2025

Direction Arrows
Standalone Net Profit

Growth in half year ended Mar 2026 is 116.81% vs 0.00% in Sep 2025

Nine Monthly Results Snapshot (Standalone) - Dec'25stock-summary

Dec'25
Dec'24
Change(%)
Net Sales
354.42
212.81
66.54%
Operating Profit (PBDIT) excl Other Income
11.73
2.08
463.94%
Interest
0.22
0.07
214.29%
Exceptional Items
0.00
0.00
Standalone Net Profit
7.74
0.00
Operating Profit Margin (Excl OI)
3.31%
0.98%
2.33%
Values in Rs Cr.
Direction Arrows
Net Sales

YoY Growth in nine months ended Dec 2025 is 66.54% vs 71.69% in Dec 2024

Direction Arrows
Standalone Net Profit

YoY Growth in nine months ended Dec 2025 is 0.00% vs -100.00% in Dec 2024

Annual Results Snapshot (Standalone) - Mar'26stock-summary

Mar'26
Mar'25
Change(%)
Net Sales
573.77
331.68
72.99%
Operating Profit (PBDIT) excl Other Income
21.09
3.99
428.57%
Interest
2.26
0.07
3,128.57%
Exceptional Items
0.00
0.00
Standalone Net Profit
10.93
0.46
2,276.09%
Operating Profit Margin (Excl OI)
3.68%
1.20%
2.48%
Values in Rs Cr.
Direction Arrows
Net Sales

YoY Growth in year ended Mar 2026 is 72.99% vs 66.96% in Mar 2025

Direction Arrows
Standalone Net Profit

YoY Growth in year ended Mar 2026 is 2,276.09% vs -83.33% in Mar 2025

stock-summaryCompany CV
About Syschem (India) Ltd stock-summary
stock-summary
Syschem (India) Ltd
Micro Cap
Pharmaceuticals & Biotechnology
Syschem (India) Limited, formerly known as Anil Pesticides Limited was incorporated on 31 December, 1993. The name of the Company was changed from Anil Pesticides Limited to Syschem (India) Limited on February 17, 2003. Company is engaged in the business of manufacturing of API / Intermediates. It has its manufacturing facility at Village Bargodam, Tehsil Kalka, Distt. Panchkula (Haryana).
Company Coordinates stock-summary
Company Details
Tehsil Kalka, Bargodam Village Panchkula Haryana : 133302
stock-summary
Tel: 91-172-3077777
stock-summary
info@syschem.in
Registrar Details
Beetal Financial & Computer Services (P) Ltd , Beetal House , 99 Mandangir, 3rd Floor, Behind Local Shopping Centre, Near Dada Harsukhdas Mandir, New Delhi