
Compare Systematix Corp. with Similar Stocks
Dashboard
With a fall in Net Sales of -30.06%, the company declared Very Negative results in Mar 26
- The company has declared negative results for the last 2 consecutive quarters
- PAT(Q) At Rs -11.48 cr has Fallen at -257.8% (vs previous 4Q average)
- NET SALES(Q) Lowest at Rs 23.50 cr
- PBDIT(Q) Lowest at Rs -9.54 cr.
Falling Participation by Institutional Investors
Stock DNA
Capital Markets
INR 869 Cr (Small Cap)
61.00
22
0.16%
0.06
4.56%
2.76
Total Returns (Price + Dividend) 
Latest dividend: 0.1 per share ex-dividend date: Sep-12-2025
Risk Adjusted Returns v/s
Returns Beta

News

Systematix Corporate Services Ltd Upgraded to Sell on Technical and Valuation Improvements
Systematix Corporate Services Ltd has seen its investment rating upgraded from Strong Sell to Sell, reflecting a nuanced shift in its technical outlook and valuation metrics despite ongoing financial challenges. The change, effective from 13 July 2026, is driven primarily by improvements in technical indicators and a more attractive valuation grade, while financial trends and quality assessments remain cautious.
Read full news article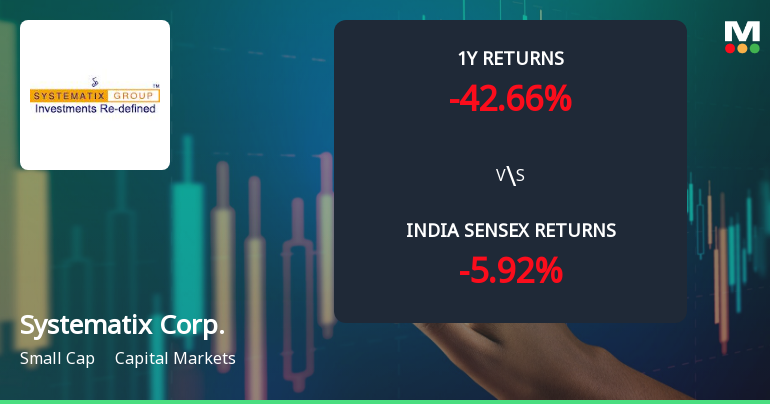
Systematix Corporate Services Ltd Shows Mixed Technical Signals Amid Prolonged Downtrend
Systematix Corporate Services Ltd, a small-cap player in the capital markets sector, has exhibited a nuanced shift in its technical momentum despite enduring a significant downtrend over the past year. Recent technical indicators reveal a mild improvement in weekly momentum, contrasting with persistent bearish signals on monthly charts, underscoring a complex outlook for investors navigating this stock’s trajectory.
Read full news article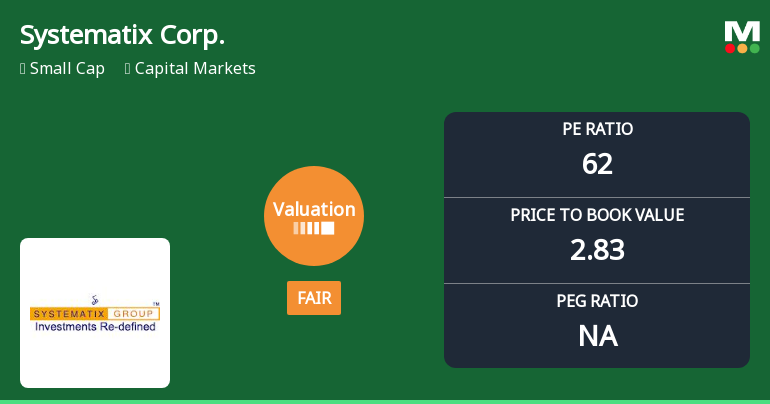
Systematix Corporate Services Ltd: Valuation Shifts Signal Changing Price Attractiveness
Systematix Corporate Services Ltd has experienced a notable shift in its valuation parameters, moving from an attractive to a fair valuation grade. This change, coupled with its elevated price-to-earnings (P/E) and price-to-book value (P/BV) ratios relative to historical and peer averages, raises important considerations for investors assessing the stock’s price attractiveness amid a challenging market backdrop.
Read full news article Announcements
Corporate Actions

No Upcoming Board Meetings

Systematix Corporate Services Ltd has declared 10% dividend, ex-date: 12 Sep 25

Systematix Corporate Services Ltd has announced 1:10 stock split, ex-date: 05 Nov 24

No Bonus history available

No Rights history available
Quality key factors
Valuation key factors
Technicals key factors
 Technical Indicator Scale: Bearish, Mildly Bearish, Sideways, Mildly Bullish, Bullish Turned
 Shareholding Snapshot : Mar 2026
Shareholding Compare (%holding)
Promoters
None
Held by 0 Schemes
Held by 6 FIIs (4.12%)
Systematix Holdings Private Limited (64.91%)
Pratik Madhukar Sheth (6.94%)
19.2%
Quarterly Results Snapshot (Consolidated) - Mar'26 - QoQ

QoQ Growth in quarter ended Mar 2026 is -30.06% vs -39.70% in Dec 2025

QoQ Growth in quarter ended Mar 2026 is -1,808.70% vs -95.24% in Dec 2025
Half Yearly Results Snapshot (Consolidated) - Sep'25
Growth in half year ended Sep 2025 is 35.06% vs 74.66% in Sep 2024
Growth in half year ended Sep 2025 is 4.52% vs 283.92% in Sep 2024
Nine Monthly Results Snapshot (Consolidated) - Dec'25
YoY Growth in nine months ended Dec 2025 is 13.35% vs 26.16% in Dec 2024
YoY Growth in nine months ended Dec 2025 is -39.59% vs 40.83% in Dec 2024
Annual Results Snapshot (Consolidated) - Mar'26
YoY Growth in year ended Mar 2026 is 4.86% vs -0.19% in Mar 2025
YoY Growth in year ended Mar 2026 is -69.73% vs -14.23% in Mar 2025
About Systematix Corporate Services Ltd

Company Coordinates


