
Compare Systematix Corp. with Similar Stocks
Dashboard
With a fall in Net Sales of -30.06%, the company declared Very Negative results in Mar 26
- The company has declared negative results for the last 2 consecutive quarters
- PAT(Q) At Rs -11.48 cr has Fallen at -257.8% (vs previous 4Q average)
- NET SALES(Q) Lowest at Rs 23.50 cr
- PBDIT(Q) Lowest at Rs -9.54 cr.
Falling Participation by Institutional Investors
Underperformed the market in the last 1 year
Stock DNA
Capital Markets
INR 909 Cr (Small Cap)
62.00
20
0.16%
0.06
4.56%
2.76
Total Returns (Price + Dividend) 
Latest dividend: 0.1 per share ex-dividend date: Sep-12-2025
Risk Adjusted Returns v/s
Returns Beta

News
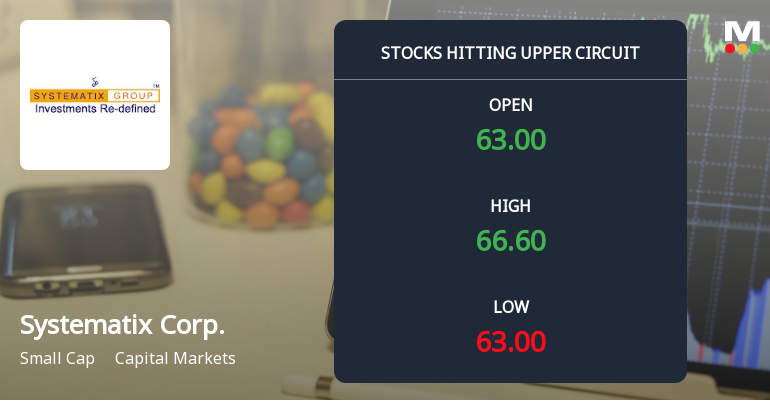
Systematix Corporate Services Ltd Locks at Upper Circuit With 5.0% Gain — Buyers Queue, Sellers Absent
At Rs 66.62, the buying was done — not because demand dried up, but because the exchange wouldn't let the stock go any higher. Systematix Corporate Services Ltd locked at its upper circuit of 5.0% on 12 Jun 2026, with buyers queuing and no sellers willing to part with shares.
Read full news article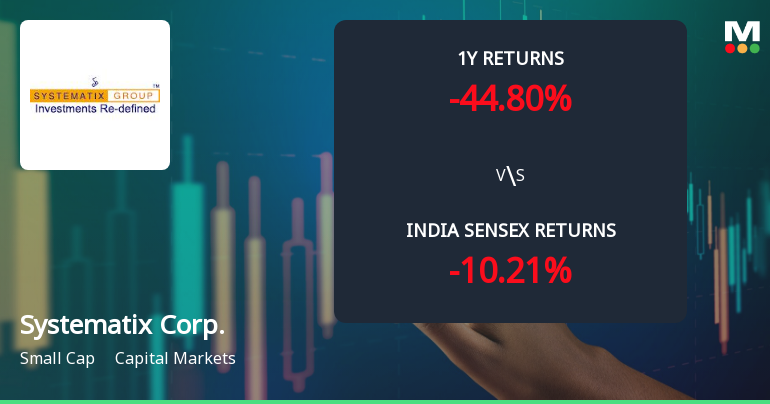
Systematix Corporate Services Ltd Technical Momentum Shifts Amid Bearish Sentiment
Systematix Corporate Services Ltd, a small-cap player in the capital markets sector, has experienced a nuanced shift in its technical momentum, reflecting a complex interplay of bullish and bearish signals. Despite a modest daily price increase, the stock remains under pressure with a strong sell rating and a significant year-to-date decline, underscoring the challenges ahead for investors.
Read full news article
Systematix Corporate Services Ltd is Rated Strong Sell
Systematix Corporate Services Ltd is rated Strong Sell by MarketsMOJO, with this rating last updated on 29 April 2026. However, the analysis and financial metrics presented here reflect the stock's current position as of 08 June 2026, providing investors with the latest insights into the company’s performance and outlook.
Read full news article Announcements
Compliances-Reg.24(A)-Annual Secretarial Compliance
19-May-2026 | Source : BSESecretarial Compliance Report for the year ended March 31 2026 under regulation 24A of SEBI (Listing Obligations and Disclosure Requirements) Regulations 2015.
Announcement under Regulation 30 (LODR)-Change in Management
15-May-2026 | Source : BSEAppointment of Mr. Ratnadeep Acharyya as Managing Director & CEO - IB and designated him as Senior Management Personnel of the Company.
Announcement under Regulation 30 (LODR)-Change in Management
08-May-2026 | Source : BSEAppointment of Ms. Rupam Lal Das as Joint Managing Director and designated her as Senior Managament Personnel of the Company.
Corporate Actions

No Upcoming Board Meetings

Systematix Corporate Services Ltd has declared 10% dividend, ex-date: 12 Sep 25

Systematix Corporate Services Ltd has announced 1:10 stock split, ex-date: 05 Nov 24

No Bonus history available

No Rights history available
Quality key factors
Valuation key factors
Technicals key factors
 Technical Indicator Scale: Bearish, Mildly Bearish, Sideways, Mildly Bullish, Bullish Turned
 Shareholding Snapshot : Mar 2026
Shareholding Compare (%holding)
Promoters
None
Held by 0 Schemes
Held by 6 FIIs (4.12%)
Systematix Holdings Private Limited (64.91%)
Pratik Madhukar Sheth (6.94%)
19.2%
Quarterly Results Snapshot (Consolidated) - Mar'26 - QoQ

QoQ Growth in quarter ended Mar 2026 is -30.06% vs -39.70% in Dec 2025

QoQ Growth in quarter ended Mar 2026 is -1,808.70% vs -95.24% in Dec 2025
Half Yearly Results Snapshot (Consolidated) - Sep'25
Growth in half year ended Sep 2025 is 35.06% vs 74.66% in Sep 2024
Growth in half year ended Sep 2025 is 4.52% vs 283.92% in Sep 2024
Nine Monthly Results Snapshot (Consolidated) - Dec'25
YoY Growth in nine months ended Dec 2025 is 13.35% vs 26.16% in Dec 2024
YoY Growth in nine months ended Dec 2025 is -39.59% vs 40.83% in Dec 2024
Annual Results Snapshot (Consolidated) - Mar'26
YoY Growth in year ended Mar 2026 is 4.86% vs -0.19% in Mar 2025
YoY Growth in year ended Mar 2026 is -69.73% vs -14.23% in Mar 2025
About Systematix Corporate Services Ltd

Company Coordinates


