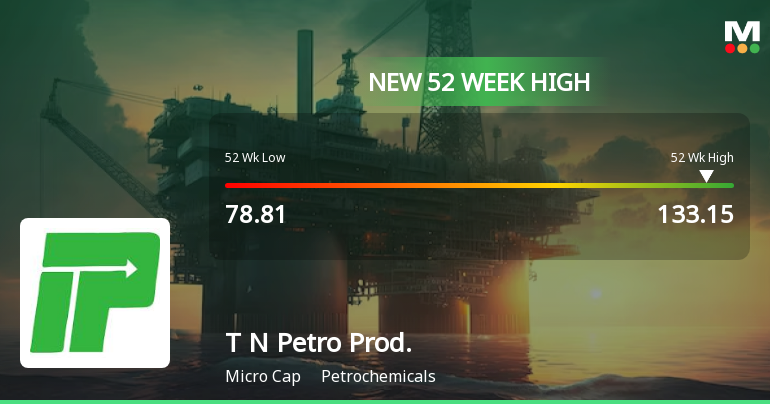
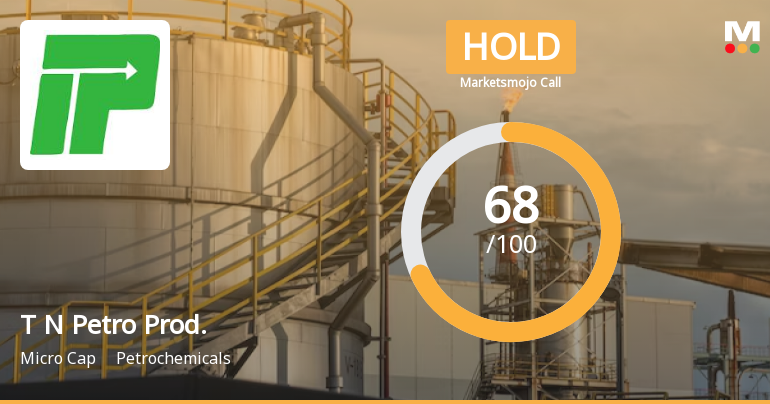
T N Petro Prod.

  • Market Cap: Micro Cap
  • Industry: Petrochemicals
  • ISIN: INE148A01019
  • NSEID: TNPETRO
  • BSEID: 500777
INR
129.90
9.37 (7.77%)
BSENSE

Sep 01, 12:59 PM

BSE+NSE Vol: 1.14 cr

  • Price Points
  • Score
  • Mojo Parameters
  • Total Return
  • News and Corporate Actions
  • Key factors
  • Shareholding
  • Financials
  • CompanyCV
stock-summaryPrice Point
High/Low

1Day

52 Week

Valuation
Technical
Day's Volume

CASH

1.14 cr (2,886.66%) Volume

Shareholding (Jun 2026)

FII

11.11%

Held by 32 FIIs

DII

0.00%

Held by 2 DIIs

Promoter

34.54%

Who are in the management team of T N Petro Prod.?

01-Sep-2026

The management team of T N Petro Prod includes Vice Chairman Ashwin C Muthiah, Whole Time Director D Senthikumar, CFO K T Vijayagopal, and several independent and non-executive directors, ensuring a blend of executive leadership and independent oversight.

The management team of T N Petro Prod includes the following members:<BR><BR>1. **Ashwin C Muthiah** - Vice Chairman<BR>2. **Dhananjay N Mungale** - Independent Director<BR>3. **Sashikala Srikanth** - Independent Director<BR>4. **D Senthikumar** - Whole Time Director (Operations)<BR>5. **N Sundaradevan** - Independent Director<BR>6. **K T Vijayagopal** - Director (Finance) & CFO<BR>7. **Shankar Chatapuram Swaminathan** - Independent Director<BR>8. **Govindarajan Dattatreyan Sharma** - Independent Director<BR>9. **Debendranath Sarangi** - Independent Director<BR>10. **R. Bhuvaneswari** - Non-Executive Director<BR>11. **Jayashree Muralidharan** - Non-Executive Director<BR><BR>This team brings a mix of executive and independent oversight to the company.

View full answer

What does T N Petro Prod. do?

01-Sep-2026

Tamil Nadu Petro Products Ltd manufactures and sells petrochemical products and operates in the micro-cap segment of the industry. As of June 2026, it reported net sales of ₹780 Cr and a net profit of ₹80 Cr, with a market cap of ₹1,010 Cr.

Overview:<BR>Tamil Nadu Petro Products Ltd is engaged in the manufacturing and selling of petrochemical products and operates within the micro-cap segment of the petrochemicals industry.<BR><BR>History:<BR>The company was incorporated on June 22, 1984, and was promoted by Tamil Nadu Industrial Development Corporation Ltd. (TIDCO). The latest quarterly results reported are for June 2026, showing net sales and profit figures.<BR><BR>Financial Snapshot:<BR>- Net Sales: 780 Cr (Quarterly Results - Jun 2026)<BR>- Net Profit: 80 Cr (Quarterly Results - Jun 2026)<BR>- Market Cap: INR 1,010 Cr (Micro Cap)<BR><BR>Key Metrics:<BR>- P/E: 8.00<BR>- Industry P/E: 13<BR>- Dividend Yield: 1.08%<BR>- Debt-Equity: 0.12<BR>- Return on Equity: 9.02%<BR>- Price to Book: 0.99<BR><BR>Contact Details:<BR>Address: Manali Express Highway, Manali Chennai Tamil Nadu : 600068<BR>Tel: 91-044-25945588<BR>Email: secy-legal@tnpetro.com<BR>Website: http://www.tnpetro.com

View full answer

Who are the peers of the T N Petro Prod.?

01-Sep-2026

T N Petro Prod.'s peers include Supreme Petrochem, Rain Industries, DCW, and others, with varying management risks and growth rates. Rain Industries leads in 1-year returns at 43.73%, while DCW has the lowest at -37.41%; T N Petro Prod. has a 1-year return of 13.80%.

Peers: The peers of T N Petro Prod. are Supreme Petroch., Rain Industries, DCW, Manali Petrochem, Agarwal Indl., Pasupati Acrylon, Indian Acrylics, Petro Carbon, Kothari Petroche.<BR><BR>Quality Snapshot: Excellent management risk is observed at Supreme Petroch., while Average management risk is found at Rain Industries, Manali Petrochem, Agarwal Indl., Pasupati Acrylon, Petro Carbon, and Kothari Petroche, and the rest. Below Average management risk is noted at DCW and Indian Acrylics. Growth is Below Average across all peers except for Manali Petrochem, which has Excellent growth. Capital Structure is Excellent for Supreme Petroch., Manali Petrochem, Pasupati Acrylon, and Kothari Petroche, Good for Agarwal Indl., and Average for DCW, while the rest have Below Average capital structures.<BR><BR>Return Snapshot: The peer with the highest 1-year return is Rain Industries at 43.73%, while the lowest is DCW at -37.41%. T N Petro Prod.'s own 1-year return is 13.80%, which is significantly higher than DCW's but lower than Rain Industries. Additionally, Agarwal Indl. and DCW have negative six-month returns.

View full answer

How big is T N Petro Prod.?

01-Sep-2026

As of 31st August, Tamil Nadu Petro Products Ltd has a market capitalization of 1,010.00 Cr, with recent net sales of 1,783.28 Cr and a net profit of 142.32 Cr.

As of 31st August, Tamil Nadu Petro Products Ltd has a market capitalization of 1,010.00 Cr, categorizing it as a Micro Cap company.<BR><BR>In the latest 4 quarters, the company reported Net Sales of 1,783.28 Cr and a Net Profit of 142.32 Cr.<BR><BR>The latest annual period for the balance sheet is March 2025, with Shareholder's Funds amounting to 911.88 Cr and Total Assets of 1,354.35 Cr.

View full answer

Why is Tamil Nadu Petro Products Ltd falling/rising?

31-Aug-2026

As of 30-Aug, Tamil Nadu Petro Products Ltd's stock price is rising, currently at 111.24, reflecting an increase of 2.01 (1.84%). The stock has shown a trend reversal after three days of decline, outperforming its sector and gaining 18.23% over the past month, indicating strong investor interest and positive market sentiment.

As of 30-Aug, Tamil Nadu Petro Products Ltd's stock price is rising, currently at 111.24, reflecting an increase of 2.01 (1.84%). This upward movement comes after a trend reversal, as the stock has gained after three consecutive days of decline. Additionally, the stock has outperformed its sector by 0.47% today, indicating a positive performance relative to its peers.<BR><BR>The stock's recent performance over the past month shows a significant increase of 18.23%, contrasting with the Sensex's modest gain of 0.65%. Year-to-date, the stock has risen by 5.19%, while the Sensex has decreased by 9.34%. This suggests that Tamil Nadu Petro Products Ltd has been resilient compared to broader market trends.<BR><BR>Moreover, there has been a notable rise in investor participation, with delivery volume on 27 August increasing by 90.67% compared to the 5-day average. This heightened interest from investors could be contributing to the stock's upward momentum. The stock also reached an intraday high of Rs 112.31 today, further indicating positive market sentiment.<BR><BR>In summary, the combination of a trend reversal, strong recent performance compared to the market, increased investor participation, and positive sector performance are key factors contributing to the rise in Tamil Nadu Petro Products Ltd's stock price.

View full answer

Should I buy, sell or hold Tamil Nadu Petro Products Ltd?

13-Aug-2026

Are Tamil Nadu Petro Products Ltd latest results good or bad?

20-May-2026

Tamil Nadu Petro Products Ltd's latest results are concerning, with Q4 FY26 showing a 59.31% drop in net profit to ₹8.09 crore and a 70.45% decline in revenue to ₹124.50 crore, raising questions about operational sustainability and increasing financial risk.

The latest results for Tamil Nadu Petro Products Ltd are concerning. In Q4 FY26, the company reported a significant decline in both net profit and revenue. Net profit fell by 59.31% quarter-on-quarter to ₹8.09 crore, while revenue plummeted by 70.45% to ₹124.50 crore. This marks the lowest quarterly sales figure in recent history, indicating potential operational disruptions or severe demand challenges in the petrochemicals market.<BR><BR>Despite a slight improvement in operating and PAT margins, which increased to 9.19% and 6.51% respectively, these gains came against a dramatically reduced revenue base. The sharp decline in sales raises questions about the company's operational sustainability and ability to navigate the current market environment.<BR><BR>Additionally, the company's interest coverage ratio has deteriorated, and it has taken on long-term debt for the first time, which adds to the financial risk. Overall, the results suggest a significant setback for the company after a period of relative stability, leading to investor concerns reflected in the stock's decline following the announcement.

View full answer

When is the next results date for Tamil Nadu Petro Products Ltd?

15-May-2026

The next results date for Tamil Nadu Petro Products Ltd is 19 May 2026.

The next results date for Tamil Nadu Petro Products Ltd is scheduled for 19 May 2026.

View full answer

Is T N Petro Prod. technically bullish or bearish?

19-Nov-2025

As of November 18, 2025, T N Petro Prod shows a mildly bullish trend, supported by daily moving averages and Bollinger Bands, but with caution advised due to mildly bearish weekly MACD and KST indicators.

As of 18 November 2025, the technical trend has changed from bullish to mildly bullish. The current stance is mildly bullish, driven by the daily moving averages indicating mild bullishness and the Bollinger Bands showing a similar trend on both weekly and monthly time frames. However, the weekly MACD and KST are mildly bearish, suggesting some caution. The monthly MACD and KST remain bullish, indicating potential strength in the longer term. Overall, the mixed signals from different indicators suggest a cautious but mildly bullish outlook for T N Petro Prod.

View full answer

Is T N Petro Prod. overvalued or undervalued?

14-Nov-2025

As of November 13, 2025, T N Petro Prod. is considered overvalued with a valuation grade of expensive, a PE ratio of 9.97, and a significant 41.39% stock return over the past year, despite trading at a premium compared to peers like Agarwal Indl. and Manali Petrochem.

As of 13 November 2025, the valuation grade for T N Petro Prod. has moved from very expensive to expensive. The company is currently considered overvalued. Key ratios include a PE ratio of 9.97, an EV to EBITDA of 7.73, and a PEG ratio of 0.07, which indicates a low growth expectation relative to its price. <BR><BR>In comparison to peers, Agarwal Indl. is rated very attractive with a PE of 13.94, while Manali Petrochem is deemed very expensive with a PE of 23.08. T N Petro Prod.'s valuation metrics suggest it is trading at a premium compared to its peers, despite its recent stock performance showing a significant return of 41.39% over the past year, which outpaces the Sensex return of 8.74%.

View full answer

How has been the historical performance of T N Petro Prod.?

12-Nov-2025

T N Petro Prod. experienced fluctuating financial performance, with net sales increasing to 1,826.77 Cr in Mar'25 from 1,668.57 Cr in Mar'24, but down from 2,150.25 Cr in Mar'23. Profit after tax rose to 58.35 Cr in Mar'25, yet remained significantly lower than 94.19 Cr in Mar'23, while total assets increased to 1,354.35 Cr in Mar'25.

Answer:<BR>The historical performance of T N Petro Prod. shows fluctuations in key financial metrics over the years, with notable trends in net sales, profits, and cash flow.<BR><BR>Breakdown:<BR>T N Petro Prod. reported net sales of 1,826.77 Cr in Mar'25, an increase from 1,668.57 Cr in Mar'24, but a decline from 2,150.25 Cr in Mar'23. The total operating income followed a similar pattern, reaching 1,826.77 Cr in Mar'25 compared to 1,668.57 Cr in Mar'24 and 2,150.25 Cr in Mar'23. The company's total expenditure, excluding depreciation, was 1,763.34 Cr in Mar'25, up from 1,596.57 Cr in Mar'24, while operating profit (PBDIT) decreased to 63.43 Cr in Mar'25 from 72.00 Cr in Mar'24 and 127.51 Cr in Mar'23. Profit before tax improved to 78.57 Cr in Mar'25 from 64.83 Cr in Mar'24, but was lower than 124.24 Cr in Mar'23. Profit after tax also increased to 58.35 Cr in Mar'25 from 50.06 Cr in Mar'24, yet it was significantly lower than 94.19 Cr in Mar'23. The company’s cash flow from operating activities rose to 206.00 Cr in Mar'25 from 161.00 Cr in Mar'24, while cash flow from investing activities showed a significant outflow of -244.00 Cr in Mar'25 compared to -69.00 Cr in Mar'24. The total assets increased to 1,354.35 Cr in Mar'25 from 1,090.67 Cr in Mar'24, reflecting growth in the company's financial position.

View full answer

Who are the top shareholders of the T N Petro Prod.?

17-Jul-2025

The top shareholders of T N Petro Prod. include Tamilnadu Industrial Development Corporation Ltd at 17.61%, individual investors at 49.06%, and notable public shareholder Shreyans Shantilal Shah with 3.85%. Additionally, 35 Foreign Institutional Investors hold 5.56%, while 15 mutual fund schemes have a minimal stake of 0.01%.

The top shareholders of T N Petro Prod. include the Tamilnadu Industrial Development Corporation Ltd, which holds the highest promoter stake at 17.61%. Additionally, individual investors collectively hold a significant portion at 49.06%. Among public shareholders, Shreyans Shantilal Shah is notable with a holding of 3.85%. The company also has 35 Foreign Institutional Investors (FIIs) holding a combined 5.56%, and 15 mutual fund schemes with a minimal stake of 0.01%.

View full answer

Has T N Petro Prod. declared dividend?

06-Jun-2025

Tamil Nadu Petro Products Ltd has declared a 12% dividend, amounting to ₹1.2 per share, with an ex-date of September 17, 2024. The dividend yield is 1.36%, and total returns have varied across periods, with a notable 190.24% total return over the last 5 years.

Tamil Nadu Petro Products Ltd has declared a 12% dividend.<BR><BR>Dividend Details:<BR>- Percentage announced: 12%<BR>- Amount per share: 1.2<BR>- Ex-date: 17 Sep 24<BR><BR>Dividend Yield: 1.36%.<BR><BR>Total Returns by Period:<BR>In the last 6 months, the price return was 3.26%, with no dividend return, resulting in a total return of 3.26%.<BR><BR>Over the past year, the price return was 7.22%, with a dividend return of 1.39%, leading to a total return of 8.61%.<BR><BR>In the 2-year period, the price return was 14.67%, with a dividend return of 3.38%, culminating in a total return of 18.05%.<BR><BR>For the 3-year period, the price return was -4.67%, while the dividend return was 6.70%, resulting in a total return of 2.03%.<BR><BR>In the 4-year period, the price return was -10.76%, with a dividend return of 7.02%, leading to a total return of -3.74%.<BR><BR>Over the last 5 years, the price return was 162.04%, with a dividend return of 28.20%, resulting in a total return of 190.24%.<BR><BR>Overall, Tamil Nadu Petro Products Ltd has declared a dividend and has shown varying total returns over different periods, with significant gains in the longer term, particularly in the last 5 years. The dividend yield indicates a modest return relative to the share price.

View full answer
iScoreScore
Click here to find our call on this stock
Strong Sell
Sell
Hold
Buy
Strong Buy

Dashboard

1

Company has a Debt to Equity ratio (avg) of 0.02 times

 
2

Poor long term growth as Operating profit has grown by an annual rate -2.88% of over the last 5 years

3

With ROCE of 9.2, it has a Fair valuation with a 1.1 Enterprise value to Capital Employed

4

Despite the size of the company, domestic mutual funds hold only 0% of the company

5

Market Beating performance in long term as well as near term

stock-summaryMojo Parameters

Mojo Parameters

Loading Valuation Snapshot...

Stock DNA

stock-summary
Industry

Petrochemicals

stock-summary
Market cap

INR 1,169 Cr (Micro Cap)

stock-summary
P/E

8.00

stock-summary
Industry P/E

13

stock-summary
Dividend Yield

0.99%

stock-summary
Debt Equity

0.12

stock-summary
Return on Equity

9.02%

stock-summary
Price to Book

1.07

Revenue and Profits:
Net Sales:
780 Cr
(Quarterly Results - Jun 2026)
Net Profit:
80 Cr
stock-summaryTotal Returns
Total Returns (Price + Dividend) stock-summary
Dividend Yield (0.99%)
TimePeriod
Price Return
Dividend Return
Total Return
3 Months
48.49%
1.71%
50.2%
6 Months
38.46%
1.73%
40.19%
1 Year
22.84%
2.64%
25.48%
2 Years
30.82%
4.10%
34.92%
3 Years
45.01%
5.82%
50.83%
4 Years
24.9%
5.18%
30.08%
5 Years
9.76%
6.68%
16.44%

Latest dividend: 1.2 per share ex-dividend date: Sep-09-2025

Risk Adjusted Returns v/s stock-summary
Returns Beta
Icon
Beta has not been calculated since enough price history is not available
stock-summaryNews & Corporate Actions

News

Announcements stock-summary

Intimation Of Record Date For Purpose Of Dividend

12-Aug-2026 | Source : BSE

Intimation of Record date for purpose of dividend for FY 2025-26

Announcement under Regulation 30 (LODR)-Change in Directorate

11-Aug-2026 | Source : BSE

Appointment of Mr.Sanket Balvantrao Waghe IAS under Non Executive and Non Independent Category

Fixing Of Record Date For The Purpose Of Dividend

11-Aug-2026 | Source : BSE

Record Date as per attachment

Corporate Actions stock-summary

stock-summary
BOARD MEETING

No Upcoming Board Meetings

stock-summary
DIVIDEND

Tamil Nadu Petro Products Ltd has declared 15% dividend, ex-date: 17 Sep 26

stock-summary
SPLITS

No Splits history available

stock-summary
BONUS

No Bonus history available

stock-summary
RIGHTS

No Rights history available

stock-summaryKey Factors

Quality key factors stock-summary

Factor
Value
Sales Growth (5y)
5.16%
EBIT Growth (5y)
-2.88%
EBIT to Interest (avg)
13.66
Debt to EBITDA (avg)
1.11
Net Debt to Equity (avg)
0.12
Sales to Capital Employed (avg)
1.91
Tax Ratio
24.08%
Dividend Payout Ratio
18.50%
Pledged Shares
0
Institutional Holding
11.11%
ROCE (avg)
17.57%
ROE (avg)
11.19%

Valuation key factors

Factor
Value
P/E Ratio
8
Industry P/E
13
Price to Book Value
1.07
EV to EBIT
7.08
EV to EBITDA
5.92
EV to Capital Employed
1.06
EV to Sales
0.68
PEG Ratio
0.09
Dividend Yield
0.99%
ROCE (Latest)
9.23%
ROE (Latest)
9.02%

Technicals key factors

Indicator
Weekly
Monthly
MACD
Bullish
Bullish
RSI
No Signal
No Signal
Bollinger Bands
Bullish
Bullish
Moving Averages
Bullish (Daily)
KST
Bullish
Mildly Bearish
Dow Theory
Mildly Bullish
Mildly Bullish
OBV
No Trend
Bullish
stock-summary Technical Indicator Scale: Bearish, Mildly Bearish, Sideways, Mildly Bullish, Bullish  Turned 
stock-summaryShareholding
Shareholding Snapshot : Jun 2026stock-summary
Shareholding Compare (%holding) stock-summary
Majority shareholders

Non Institution

Pledged Promoter Holdings

None

Mutual Funds

Held by 5 Schemes (0.0%)

FIIs

Held by 32 FIIs (11.11%)

Promoter with highest holding

Tamilnadu Industrial Development Corporation Ltd (17.61%)

Highest Public shareholder

Ares Diversified (4.9%)

Individual Investors Holdings

42.41%

stock-summaryFinancial
[
  {
    "link": "quarterly",
    "btn_text": "All Quarterly Results",
    "header": "Quarterly Results Snapshot (Consolidated) - Jun'26 - QoQ",
    "rhs": [
      {
        "prefix": "Net Sales ",
        "suffix": "QoQ Growth in quarter ended Jun 2026 is 526.63% vs -70.45% in Mar 2026",
        "dir": 1
      },
      {
        "prefix": "Consolidated Net Profit ",
        "suffix": "QoQ Growth in quarter ended Jun 2026 is 890.23% vs -59.31% in Mar 2026",
        "dir": 1
      }
    ],
    "table": {
      "header": [
        "Jun'26",
        "Mar'26",
        "Change(%)"
      ],
      "body": [
        {
          "field": "Net Sales",
          "val1": "780.15",
          "val2": "124.50",
          "chgp": "526.63%",
          "chgp_class": "positive"
        },
        {
          "field": "Operating Profit (PBDIT) excl Other Income",
          "val1": "120.55",
          "val2": "11.42",
          "chgp": "955.60%",
          "chgp_class": "positive"
        },
        {
          "field": "Interest",
          "val1": "7.54",
          "val2": "5.34",
          "chgp": "41.20%",
          "chgp_class": "negative"
        },
        {
          "field": "Exceptional Items",
          "val1": "0.00",
          "val2": "7.62",
          "chgp": "-100.00%",
          "chgp_class": "negative"
        },
        {
          "field": "Consolidate Net Profit",
          "val1": "80.11",
          "val2": "8.09",
          "chgp": "890.23%",
          "chgp_class": "positive"
        },
        {
          "field": "Operating Profit Margin (Excl OI)",
          "val1": "15.50%",
          "val2": "9.19%",
          "chgp": "6.31%",
          "chgp_class": "positive"
        }
      ]
    }
  },
  {
    "link": "half-yearly",
    "btn_text": "All Half Yearly Results",
    "header": "Half Yearly Results Snapshot (Consolidated) - Sep'25",
    "rhs": [
      {
        "prefix": "Net Sales ",
        "suffix": " Growth in half year ended Sep 2025 is 0.95% vs 3.02% in Sep 2024",
        "dir": -1
      },
      {
        "prefix": "Consolidated Net Profit ",
        "suffix": " Growth in half year ended Sep 2025 is 251.49% vs -40.51% in Sep 2024",
        "dir": 1
      }
    ],
    "table": {
      "header": [
        "Sep'25",
        "Sep'24",
        "Change(%)"
      ],
      "body": [
        {
          "field": "Net Sales",
          "val1": "920.35",
          "val2": "911.70",
          "chgp": "0.95%",
          "chgp_class": "positive"
        },
        {
          "field": "Operating Profit (PBDIT) excl Other Income",
          "val1": "88.59",
          "val2": "18.97",
          "chgp": "367.00%",
          "chgp_class": "positive"
        },
        {
          "field": "Interest",
          "val1": "4.10",
          "val2": "2.78",
          "chgp": "47.48%",
          "chgp_class": "negative"
        },
        {
          "field": "Exceptional Items",
          "val1": "-0.59",
          "val2": "7.11",
          "chgp": "-108.30%",
          "chgp_class": "negative"
        },
        {
          "field": "Consolidate Net Profit",
          "val1": "69.49",
          "val2": "19.77",
          "chgp": "251.49%",
          "chgp_class": "positive"
        },
        {
          "field": "Operating Profit Margin (Excl OI)",
          "val1": "9.64%",
          "val2": "2.08%",
          "chgp": "7.56%",
          "chgp_class": "positive"
        }
      ]
    }
  },
  {
    "link": "nine-monthly",
    "btn_text": "All Nine Monthly Results",
    "header": "Nine Monthly Results Snapshot (Consolidated) - Dec'25",
    "rhs": [
      {
        "prefix": "Net Sales ",
        "suffix": "YoY Growth in nine months ended Dec 2025 is -2.21% vs 11.46% in Dec 2024",
        "dir": -1
      },
      {
        "prefix": "Consolidated Net Profit ",
        "suffix": "YoY Growth in nine months ended Dec 2025 is 183.98% vs -16.68% in Dec 2024",
        "dir": 1
      }
    ],
    "table": {
      "header": [
        "Dec'25",
        "Dec'24",
        "Change(%)"
      ],
      "body": [
        {
          "field": "Net Sales",
          "val1": "1,341.64",
          "val2": "1,371.98",
          "chgp": "-2.21%",
          "chgp_class": "negative"
        },
        {
          "field": "Operating Profit (PBDIT) excl Other Income",
          "val1": "119.68",
          "val2": "37.54",
          "chgp": "218.81%",
          "chgp_class": "positive"
        },
        {
          "field": "Interest",
          "val1": "10.89",
          "val2": "4.52",
          "chgp": "140.93%",
          "chgp_class": "negative"
        },
        {
          "field": "Exceptional Items",
          "val1": "-0.59",
          "val2": "6.25",
          "chgp": "-109.44%",
          "chgp_class": "negative"
        },
        {
          "field": "Consolidate Net Profit",
          "val1": "89.37",
          "val2": "31.47",
          "chgp": "183.98%",
          "chgp_class": "positive"
        },
        {
          "field": "Operating Profit Margin (Excl OI)",
          "val1": "8.92%",
          "val2": "2.74%",
          "chgp": "6.18%",
          "chgp_class": "positive"
        }
      ]
    }
  },
  {
    "link": "annual",
    "btn_text": "All Annual Results",
    "header": "Annual Results Snapshot (Consolidated) - Mar'26",
    "rhs": [
      {
        "prefix": "Net Sales ",
        "suffix": "YoY Growth in year ended Mar 2026 is -19.74% vs 9.48% in Mar 2025",
        "dir": -1
      },
      {
        "prefix": "Consolidated Net Profit ",
        "suffix": "YoY Growth in year ended Mar 2026 is 67.01% vs 16.56% in Mar 2025",
        "dir": 1
      }
    ],
    "table": {
      "header": [
        "Mar'26",
        "Mar'25",
        "Change(%)"
      ],
      "body": [
        {
          "field": "Net Sales",
          "val1": "1,466.14",
          "val2": "1,826.77",
          "chgp": "-19.74%",
          "chgp_class": "negative"
        },
        {
          "field": "Operating Profit (PBDIT) excl Other Income",
          "val1": "131.10",
          "val2": "63.43",
          "chgp": "106.68%",
          "chgp_class": "positive"
        },
        {
          "field": "Interest",
          "val1": "16.23",
          "val2": "6.26",
          "chgp": "159.27%",
          "chgp_class": "negative"
        },
        {
          "field": "Exceptional Items",
          "val1": "7.02",
          "val2": "18.50",
          "chgp": "-62.05%",
          "chgp_class": "negative"
        },
        {
          "field": "Consolidate Net Profit",
          "val1": "97.45",
          "val2": "58.35",
          "chgp": "67.01%",
          "chgp_class": "positive"
        },
        {
          "field": "Operating Profit Margin (Excl OI)",
          "val1": "8.95%",
          "val2": "3.48%",
          "chgp": "5.47%",
          "chgp_class": "positive"
        }
      ]
    }
  }
]

Quarterly Results Snapshot (Consolidated) - Jun'26 - QoQstock-summary

Jun'26
Mar'26
Change(%)
Net Sales
780.15
124.50
526.63%
Operating Profit (PBDIT) excl Other Income
120.55
11.42
955.60%
Interest
7.54
5.34
41.20%
Exceptional Items
0.00
7.62
-100.00%
Consolidate Net Profit
80.11
8.09
890.23%
Operating Profit Margin (Excl OI)
15.50%
9.19%
6.31%
Values in Rs Cr.
Direction Arrows
Net Sales

QoQ Growth in quarter ended Jun 2026 is 526.63% vs -70.45% in Mar 2026

Direction Arrows
Consolidated Net Profit

QoQ Growth in quarter ended Jun 2026 is 890.23% vs -59.31% in Mar 2026

Half Yearly Results Snapshot (Consolidated) - Sep'25stock-summary

Sep'25
Sep'24
Change(%)
Net Sales
920.35
911.70
0.95%
Operating Profit (PBDIT) excl Other Income
88.59
18.97
367.00%
Interest
4.10
2.78
47.48%
Exceptional Items
-0.59
7.11
-108.30%
Consolidate Net Profit
69.49
19.77
251.49%
Operating Profit Margin (Excl OI)
9.64%
2.08%
7.56%
Values in Rs Cr.
Direction Arrows
Net Sales

Growth in half year ended Sep 2025 is 0.95% vs 3.02% in Sep 2024

Direction Arrows
Consolidated Net Profit

Growth in half year ended Sep 2025 is 251.49% vs -40.51% in Sep 2024

Nine Monthly Results Snapshot (Consolidated) - Dec'25stock-summary

Dec'25
Dec'24
Change(%)
Net Sales
1,341.64
1,371.98
-2.21%
Operating Profit (PBDIT) excl Other Income
119.68
37.54
218.81%
Interest
10.89
4.52
140.93%
Exceptional Items
-0.59
6.25
-109.44%
Consolidate Net Profit
89.37
31.47
183.98%
Operating Profit Margin (Excl OI)
8.92%
2.74%
6.18%
Values in Rs Cr.
Direction Arrows
Net Sales

YoY Growth in nine months ended Dec 2025 is -2.21% vs 11.46% in Dec 2024

Direction Arrows
Consolidated Net Profit

YoY Growth in nine months ended Dec 2025 is 183.98% vs -16.68% in Dec 2024

Annual Results Snapshot (Consolidated) - Mar'26stock-summary

Mar'26
Mar'25
Change(%)
Net Sales
1,466.14
1,826.77
-19.74%
Operating Profit (PBDIT) excl Other Income
131.10
63.43
106.68%
Interest
16.23
6.26
159.27%
Exceptional Items
7.02
18.50
-62.05%
Consolidate Net Profit
97.45
58.35
67.01%
Operating Profit Margin (Excl OI)
8.95%
3.48%
5.47%
Values in Rs Cr.
Direction Arrows
Net Sales

YoY Growth in year ended Mar 2026 is -19.74% vs 9.48% in Mar 2025

Direction Arrows
Consolidated Net Profit

YoY Growth in year ended Mar 2026 is 67.01% vs 16.56% in Mar 2025

stock-summaryCompany CV
About Tamil Nadu Petro Products Ltd stock-summary
stock-summary
Tamil Nadu Petro Products Ltd
Micro Cap
Petrochemicals
Tamilnadu Petroproducts Limited (TPL) was incorporated on June 22, 1984 and was promoted by Tamil Nadu Industrial Development Corporation Ltd. (TIDCO). The Company is currently engaged in the manufacturing and selling of petrochemical products, Linear Alkyl Benzene (LAB), Epichlorohydrin (ECH) and Caustic Soda from the manufacturing facilities situated at Manali, near Chennai. The product is used for manufacturing detergents and cleaning products, epoxy resins, and textiles.
Company Coordinates stock-summary
Company Details
Manali Express Highway, Manali Chennai Tamil Nadu : 600068
stock-summary
Tel: 91-044-25945588
stock-summary
secy-legal@tnpetro.com
Registrar Details
Cameo Corporate Services Ltd , Subramanian Buildings No 1 , Club House Road, Chennai