
Compare T T with Similar Stocks
Dashboard
Weak Long Term Fundamental Strength with a -20.91% CAGR growth in Operating Profits over the last 5 years
- Low ability to service debt as the company has a high Debt to EBITDA ratio of 7.36 times
- The company has been able to generate a Return on Equity (avg) of 4.98% signifying low profitability per unit of shareholders funds
Flat results in Mar 26
Below par performance in long term as well as near term
Stock DNA
Garments & Apparels
INR 164 Cr (Micro Cap)
537.00
25
0.79%
0.63
0.24%
1.31
Total Returns (Price + Dividend) 
Latest dividend: 0.05 per share ex-dividend date: Sep-17-2025
Risk Adjusted Returns v/s
Returns Beta

News
When is the next results date for T T Ltd?
The next results date for T T Ltd is scheduled for 06 August 2026....
Read full news article
T T Ltd is Rated Strong Sell by MarketsMOJO
T T Ltd is rated Strong Sell by MarketsMOJO, with this rating last updated on 01 Aug 2025. However, the analysis and financial metrics discussed here reflect the stock's current position as of 27 July 2026, providing investors with an up-to-date view of the company's performance and outlook.
Read full news article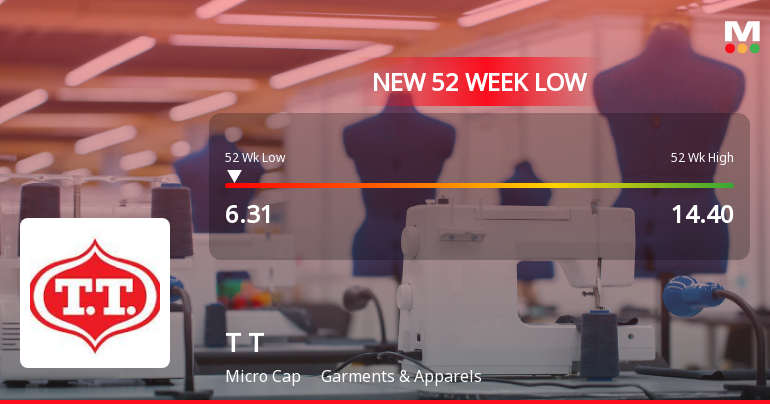
T T Ltd Falls to 52-Week Low of Rs 6.31 Amidst Prolonged Downtrend
For the third consecutive session, T T Ltd has closed lower, slipping to within 2.17% of its 52-week low at Rs 6.31 on 21 Jul 2026, marking a continuation of a steep decline that has seen the stock lose over half its value in the past year.
Read full news article Announcements
Board Meeting Intimation for Inter Alia To Consider And Approve The Unaudited Financial Result For The Quarter Ended June 30 2026 Along With Limited Review Report Thereon.
24-Jul-2026 | Source : BSET T Ltd-has informed BSE that the meeting of the Board of Directors of the Company is scheduled on 06/08/2026 inter alia to consider and approve the unaudited Financial result for the quarter ended June 30 2026 along with limited review report thereon.
Announcement under Regulation 30 (LODR)-Updates on Acquisition
18-Jul-2026 | Source : BSEIntimation under regulation 30 of SEBI LODR we wish to inform you that further to our earlier intimation to stock exchange the proposed company i.e. T T Capital Partners Limited has been incorporated.
Compliances-Certificate under Reg. 74 (5) of SEBI (DP) Regulations 2018
11-Jul-2026 | Source : BSESubmission of compliance certificate under Regulation 74(5) of SEBI (DP) Regulation.
Corporate Actions

06 Aug 2026

T T Ltd has declared 5% dividend, ex-date: 17 Sep 25

T T Ltd has announced 1:10 stock split, ex-date: 12 Feb 25

No Bonus history available

T T Ltd has announced 4:27 rights issue, ex-date: 04 Jul 25
Quality key factors
Valuation key factors
Technicals key factors
 Technical Indicator Scale: Bearish, Mildly Bearish, Sideways, Mildly Bullish, Bullish Turned
 Shareholding Snapshot : Jun 2026
Shareholding Compare (%holding)
Promoters
None
Held by 0 Schemes
Held by 0 FIIs
T T Brands Ltd. (34.44%)
Gandhi Tejas Harilal (5.12%)
39.78%
Quarterly Results Snapshot (Standalone) - Mar'26 - QoQ

QoQ Growth in quarter ended Mar 2026 is 40.65% vs -11.12% in Dec 2025
QoQ Growth in quarter ended Mar 2026 is 169.00% vs -655.56% in Dec 2025
Half Yearly Results Snapshot (Standalone) - Sep'25
Growth in half year ended Sep 2025 is -1.59% vs -11.24% in Sep 2024

Growth in half year ended Sep 2025 is -91.67% vs 1,141.38% in Sep 2024
Nine Monthly Results Snapshot (Standalone) - Dec'25
YoY Growth in nine months ended Dec 2025 is -11.52% vs -4.83% in Dec 2024
YoY Growth in nine months ended Dec 2025 is -104.87% vs 613.12% in Dec 2024
Annual Results Snapshot (Standalone) - Mar'26
YoY Growth in year ended Mar 2026 is -10.68% vs 1.61% in Mar 2025
YoY Growth in year ended Mar 2026 is -92.93% vs -11.45% in Mar 2025
About T T Ltd

Company Coordinates


