
Compare Tahmar Enterp. with Similar Stocks
Dashboard
With a Operating Losses, the company has a Weak Long Term Fundamental Strength
- Poor long term growth as Operating profit has grown by an annual rate -248.20% of over the last 5 years
- Company's ability to service its debt is weak with a poor EBIT to Interest (avg) ratio of -2.95
Negative results in Mar 26
Risky - Negative EBITDA
Below par performance in long term as well as near term
Stock DNA
Beverages
INR 81 Cr (Micro Cap)
NA (Loss Making)
17
0.00%
0.49
-6.90%
0.99
Total Returns (Price + Dividend) 
Tahmar Enterp. for the last several years.
Risk Adjusted Returns v/s
Returns Beta

News
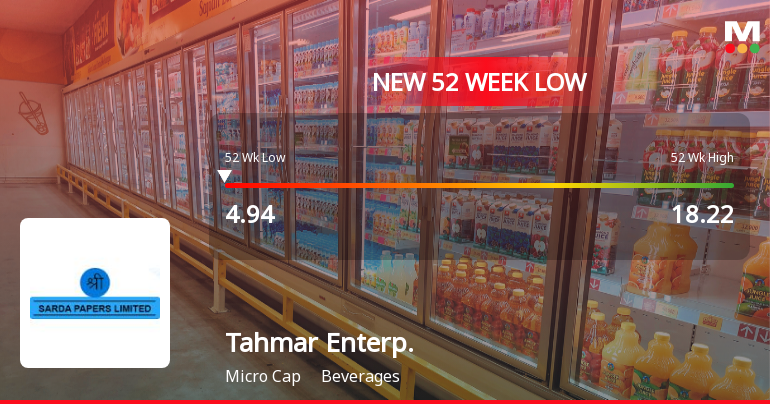
Tahmar Enterprises Ltd Falls to 52-Week Low Amidst Prolonged Downtrend
A steep decline of over 70% in the past year has dragged Tahmar Enterprises Ltd to within 3.14% of its 52-week low of Rs 4.94, marking a significant erosion in shareholder value despite a market environment that has seen mixed fortunes.
Read full news article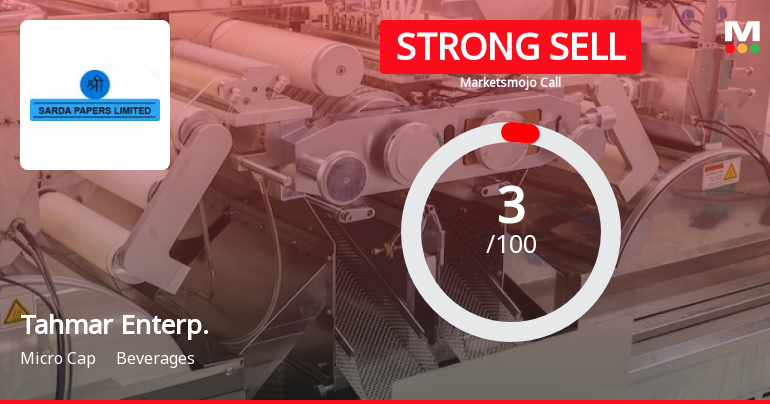
Tahmar Enterprises Ltd is Rated Strong Sell
Tahmar Enterprises Ltd is rated Strong Sell by MarketsMOJO, with this rating last updated on 17 Feb 2025. However, the analysis and financial metrics discussed here reflect the company’s current position as of 28 June 2026, providing investors with an up-to-date view of its fundamentals, returns, and overall outlook.
Read full news article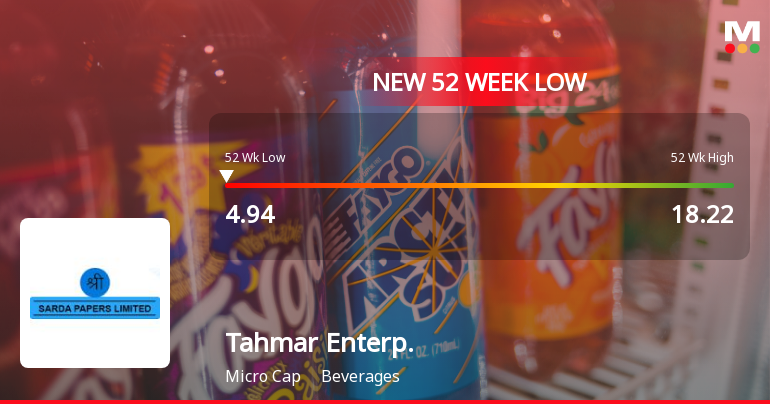
Tahmar Enterprises Ltd Falls to 52-Week Low of Rs 4.94 as Sell-Off Deepens
A sharp decline has pushed Tahmar Enterprises Ltd to a fresh 52-week low of Rs 4.94 on 24 Jun 2026, marking a 65.02% drop over the past year and signalling intensified selling pressure despite a broadly rising market.
Read full news article Announcements
Closure of Trading Window
26-Jun-2026 | Source : BSEClosure of Trading Window
Announcement under Regulation 30 (LODR)-Newspaper Publication
02-Jun-2026 | Source : BSEnewspaper publication
Board Meeting Outcome for Outcome Of Board Meeting
30-May-2026 | Source : BSEOutcome of Board Meeting
Corporate Actions

No Upcoming Board Meetings

No Dividend history available

No Splits history available

No Bonus history available

No Rights history available
Quality key factors
Valuation key factors
Technicals key factors
 Technical Indicator Scale: Bearish, Mildly Bearish, Sideways, Mildly Bullish, Bullish Turned
 Shareholding Snapshot : Mar 2026
Shareholding Compare (%holding)
Promoters
None
Held by 0 Schemes
Held by 1 FIIs (0.03%)
Sarita Alice Sequeira (45.95%)
Mastermind Jpin Sme Growth Fund (10.4%)
23.32%
Quarterly Results Snapshot (Standalone) - Mar'26 - YoY

YoY Growth in quarter ended Mar 2026 is -90.32% vs -86.75% in Mar 2025

YoY Growth in quarter ended Mar 2026 is -84.54% vs -921.05% in Mar 2025
Half Yearly Results Snapshot (Standalone) - Sep'25
Growth in half year ended Sep 2025 is -12.74% vs 62.89% in Sep 2024
Growth in half year ended Sep 2025 is -159.46% vs 36.21% in Sep 2024
Nine Monthly Results Snapshot (Standalone) - Dec'25
YoY Growth in nine months ended Dec 2025 is -36.24% vs 14.47% in Dec 2024
YoY Growth in nine months ended Dec 2025 is -187.14% vs 23.08% in Dec 2024
Annual Results Snapshot (Standalone) - Mar'26
YoY Growth in year ended Mar 2026 is -40.57% vs -28.99% in Mar 2025
YoY Growth in year ended Mar 2026 is -114.56% vs -5,320.00% in Mar 2025
About Tahmar Enterprises Ltd

Company Coordinates


