
Compare Tai Industries with Similar Stocks
Dashboard
Weak Long Term Fundamental Strength with a -3.27% CAGR growth in Net Sales over the last 5 years
- Company's ability to service its debt is weak with a poor EBIT to Interest (avg) ratio of 0.28
- The company has been able to generate a Return on Equity (avg) of 8.92% signifying low profitability per unit of shareholders funds
Flat results in Mar 26
Risky - Negative EBITDA
Stock DNA
Trading & Distributors
INR 17 Cr (Micro Cap)
193.00
15
0.00%
-0.22
0.13%
0.56
Total Returns (Price + Dividend) 
Latest dividend: 0.7000 per share ex-dividend date: Sep-16-2015
Risk Adjusted Returns v/s
Returns Beta

News

Tai Industries Q4 FY26: Wafer-Thin Margins Raise Sustainability Concerns Despite Revenue Recovery
Tai Industries Limited, a micro-cap trading and distribution company with a market capitalisation of ₹17.00 crores, reported a marginal net profit of ₹0.04 crores for Q4 FY26, marking a modest sequential improvement from a loss of ₹0.30 crores in Q3 FY26. However, the company's razor-thin profit margins and erratic quarterly performance continue to raise serious questions about operational sustainability and long-term viability.
Read full news articleWhen is the next results date for Tai Industries Ltd?
The next results date for Tai Industries Ltd is scheduled for 28 May 2026....
Read full news article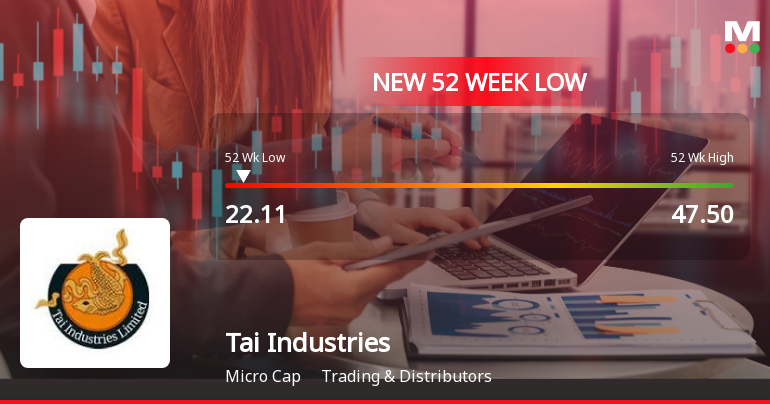
Tai Industries Ltd Falls to 52-Week Low of Rs 20.7 as Sell-Off Deepens
A sharp decline in Tai Industries Ltd has pushed the stock to a fresh 52-week low of Rs 20.7 on 24 Mar 2026, marking a significant 12.18% drop in a single session and extending a two-day losing streak that has erased over 18% of its value. This downturn contrasts starkly with the broader market's mixed performance and highlights persistent challenges for this micro-cap player in the Trading & Distributors sector.
Read full news article Announcements
Compliances-Reg.24(A)-Annual Secretarial Compliance
30-May-2026 | Source : BSEIn Compliance with the Regulations 24A of SEBI(LODR)Regulations 2015 Listing Regulations Please find attached herewith The Secretarial Compliance Report for the year ended 31.03.2026 issued by Indrani Chaudhuripracticing Company Secretary. This is for your records.
Board Meeting Outcome for Outcome Of The Board Meeting Pursuant To Regulation 30 Read With Part A Of Schedule III And Regulation 33 Of SEBI (Listing Obligations And Disclosure Requirements) Regulations 2015.
28-May-2026 | Source : BSEFurther to our letter no TAI/SEC/SEBI LODR/26-27/019 dated 20th May 2026 we hereby inform that the Board of Directors at its Meeting held today i.e. 28th May 2026 has considered and approved the Audited Financial Results for the quarter and year ended 31st March 2026. The Auditors have given their Report with unmodified opinion on the Audited Financial Results of the Company for the year ended 31st March 2026. Please find enclosed the Financial Results as follows: Audited Financial Results for the quarter and year ended 31st March 2026. Auditors Report on Audited Financial Results. Annexure - 1 Declaration for the unmodified Auditors Report. The Board Meeting held today commenced at 12.00 p.m. and concluded at 5.45 p.m.
Audited Financial Results For The Quarter And Year Ended 31St March 2026.
28-May-2026 | Source : BSEEnclosed please find the Audited Financials Results of the company together with the Independent Auditors Report pursuant to Regulations 33(3)of SEBI (LODR) Regulations 2015 for the quarter ended 31st March 2026. Kindly take the same on record.
Corporate Actions

No Upcoming Board Meetings

Tai Industries Ltd has declared 7% dividend, ex-date: 16 Sep 15

No Splits history available

No Bonus history available

No Rights history available
Quality key factors
Valuation key factors
Technicals key factors
 Technical Indicator Scale: Bearish, Mildly Bearish, Sideways, Mildly Bullish, Bullish Turned
 Shareholding Snapshot : Mar 2026
Shareholding Compare (%holding)
Non Institution
None
Held by 0 Schemes
Held by 0 FIIs
Dasho U Dorji (20.27%)
Rajpad Traders Private Limited (5%)
25.05%
Quarterly Results Snapshot (Standalone) - Mar'26 - QoQ

QoQ Growth in quarter ended Mar 2026 is 54.15% vs 30.72% in Dec 2025
QoQ Growth in quarter ended Mar 2026 is 113.33% vs -185.71% in Dec 2025
Half Yearly Results Snapshot (Standalone) - Sep'25

Growth in half year ended Sep 2025 is -63.67% vs 75.80% in Sep 2024
Growth in half year ended Sep 2025 is -56.25% vs 17.65% in Sep 2024
Nine Monthly Results Snapshot (Standalone) - Dec'25
YoY Growth in nine months ended Dec 2025 is -56.45% vs 93.43% in Dec 2024
YoY Growth in nine months ended Dec 2025 is -95.50% vs 44.16% in Dec 2024
Annual Results Snapshot (Standalone) - Mar'26
YoY Growth in year ended Mar 2026 is -43.76% vs 89.51% in Mar 2025
YoY Growth in year ended Mar 2026 is -91.30% vs -18.44% in Mar 2025
About Tai Industries Ltd

Company Coordinates


