
Compare TajGVK Hotels with Similar Stocks
Stock DNA
Hotels & Resorts
INR 2,132 Cr (Small Cap)
16.00
38
0.59%
-0.02
13.42%
2.09
Total Returns (Price + Dividend) 
Latest dividend: 2 per share ex-dividend date: Sep-08-2025
Risk Adjusted Returns v/s
Returns Beta

News
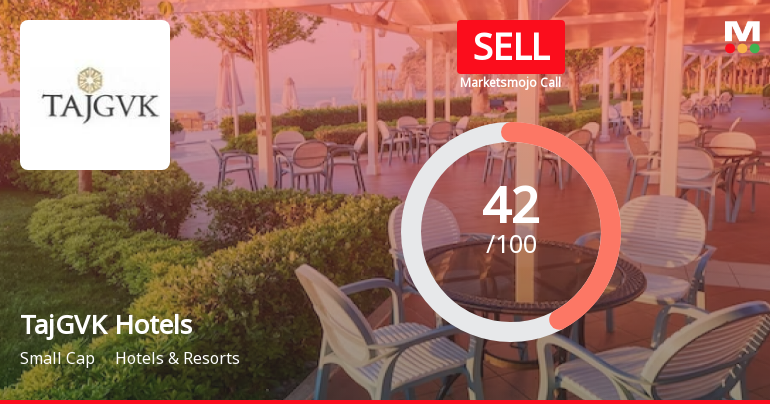
TajGVK Hotels & Resorts Ltd is Rated Sell
TajGVK Hotels & Resorts Ltd is rated Sell by MarketsMOJO, with this rating last updated on 04 Nov 2025. However, the analysis and financial metrics presented here reflect the stock's current position as of 14 June 2026, providing investors with an up-to-date view of the company’s fundamentals, returns, and market standing.
Read full news article
TajGVK Hotels & Resorts Ltd is Rated Sell
TajGVK Hotels & Resorts Ltd is rated Sell by MarketsMOJO, with this rating last updated on 04 Nov 2025. However, the analysis and financial metrics presented here reflect the stock's current position as of 03 June 2026, providing investors with an up-to-date view of the company’s fundamentals, returns, and market standing.
Read full news article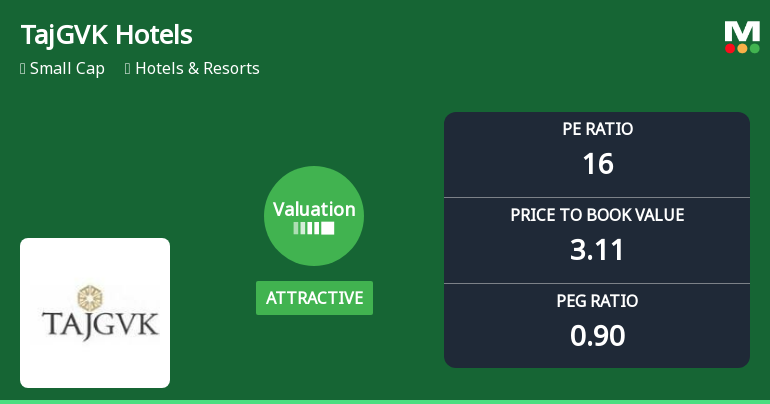
TajGVK Hotels & Resorts Ltd: Valuation Shifts Signal Renewed Price Attractiveness
TajGVK Hotels & Resorts Ltd has witnessed a notable improvement in its valuation parameters, shifting from very attractive to attractive, driven primarily by a more favourable price-to-earnings (P/E) ratio and price-to-book value (P/BV) metrics. Despite this positive valuation shift, the stock’s recent returns have been mixed compared to the broader Sensex, reflecting a complex investment landscape for this small-cap player in the Hotels & Resorts sector.
Read full news article Announcements
Announcement under Regulation 30 (LODR)-Press Release / Media Release
09-Jun-2026 | Source : BSEPress Release
Announcement under Regulation 30 (LODR)-Analyst / Investor Meet - Intimation
01-Jun-2026 | Source : BSEAnalyst / institutional investors meeting
Announcement under Regulation 30 (LODR)-Investor Presentation
28-May-2026 | Source : BSETAJ GVK Investor Presentation
Corporate Actions

No Upcoming Board Meetings

TajGVK Hotels & Resorts Ltd has declared 100% dividend, ex-date: 08 Sep 25

No Splits history available

No Bonus history available

No Rights history available
Quality key factors
Valuation key factors
Technicals key factors
 Technical Indicator Scale: Bearish, Mildly Bearish, Sideways, Mildly Bullish, Bullish Turned
 Shareholding Snapshot : Mar 2026
Shareholding Compare (%holding)
Promoters
30.2706
Held by 2 Schemes (0.4%)
Held by 20 FIIs (0.31%)
Shalini Bhupal (25.53%)
Nippon India Equity Opportunities Aif - Scheme 7 (1.3%)
19.9%
Quarterly Results Snapshot (Consolidated) - Mar'26 - YoY

YoY Growth in quarter ended Mar 2026 is 27.06% vs 7.70% in Mar 2025
YoY Growth in quarter ended Mar 2026 is 818.82% vs 11.50% in Mar 2025
Half Yearly Results Snapshot (Consolidated) - Sep'25

Growth in half year ended Sep 2025 is 7.87% vs 9.37% in Sep 2024
Growth in half year ended Sep 2025 is 29.90% vs 34.15% in Sep 2024
Nine Monthly Results Snapshot (Consolidated) - Dec'25
YoY Growth in nine months ended Dec 2025 is 7.70% vs 11.22% in Dec 2024
YoY Growth in nine months ended Dec 2025 is 9.87% vs 33.99% in Dec 2024
Annual Results Snapshot (Consolidated) - Mar'26
YoY Growth in year ended Mar 2026 is 13.07% vs 10.22% in Mar 2025
YoY Growth in year ended Mar 2026 is 250.09% vs 26.42% in Mar 2025
About TajGVK Hotels & Resorts Ltd

Company Coordinates


