
Compare Tapestry, Inc. with Similar Stocks
Dashboard
High Management Efficiency with a high ROCE of 34.98%
Strong ability to service debt as the company has a low Debt to EBITDA ratio of 0.68 times
Strong Long Term Fundamental Strength with an average Return on Capital Employed (ROCE) of 34.98%
Flat results in Jun 25
With ROCE of 41.04%, it has a expensive valuation with a 5.36 Enterprise value to Capital Employed
Market Beating performance in long term as well as near term
Total Returns (Price + Dividend) 
Tapestry, Inc. for the last several years.
Risk Adjusted Returns v/s
News
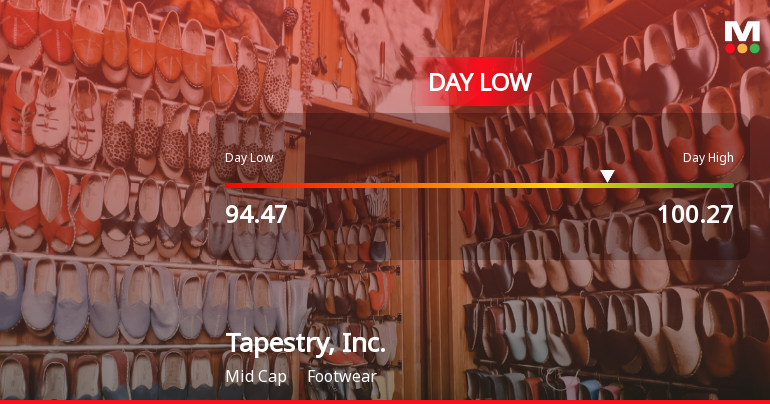
Tapestry, Inc. Hits Day Low at $94.47 Amid Price Pressure
Tapestry, Inc. faced a notable stock decline today, reaching an intraday low amid a challenging trading session. Despite recent short-term losses, the company has shown substantial long-term growth and maintains a strong financial position, highlighted by impressive ratios and a significant market capitalization in the footwear industry.
Read full news article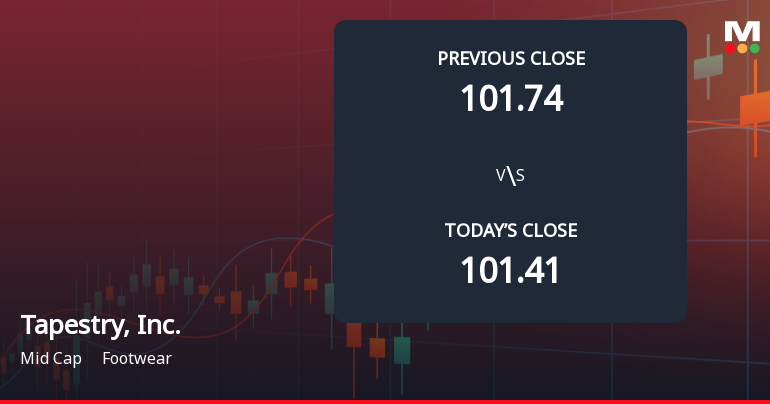
Tapestry Stock Gaps Down 10.35% Amid Weak Start and Market Concerns
Tapestry, Inc. experienced a significant decline in stock performance today, reflecting a broader downturn over the past month. Despite this, the company maintains a strong market capitalization and impressive financial metrics, including a high return on equity and substantial dividend yield, amidst mixed technical indicators.
Read full news articleIs Tapestry, Inc. technically bullish or bearish?
As of 31 October 2025, the technical trend for Tapestry, Inc. has changed from bullish to mildly bullish. The weekly MACD is mildly bearish, while the monthly MACD is bullish, indicating mixed signals. The Bollinger Bands show a mildly bullish stance on both weekly and monthly time frames. Daily moving averages are mildly bullish, suggesting some upward momentum. However, the KST and Dow Theory indicate a mildly bearish trend on the weekly level, contrasting with their bullish monthly readings. Despite the recent decline in price, Tapestry has shown strong multi-period returns, outperforming the S&P 500 significantly with a 1-year return of 126.51% compared to 19.89% for the index, and a 5-year return of 342.19% versus 109.18%. Overall, the current technical stance is mildly bullish, driven by mixed indicators across different time frames....
Read full news article Announcements

Corporate Actions
Quality key factors
Valuation key factors
Technicals key factors
 Technical Indicator Scale: Bearish, Mildly Bearish, Sideways, Mildly Bullish, Bullish Turned
 Shareholding Snapshot : Sep 2025
Shareholding Compare (%holding)
Domestic Funds
Held in 142 Schemes (48.69%)
Held by 346 Foreign Institutions (21.69%)
Quarterly Results Snapshot (Consolidated) - Jun'25 - YoY

YoY Growth in quarter ended Jun 2025 is 8.30% vs -1.75% in Jun 2024

YoY Growth in quarter ended Jun 2025 is -424.61% vs -28.92% in Jun 2024
Annual Results Snapshot (Consolidated) - Jun'25
YoY Growth in year ended Jun 2025 is 5.09% vs 0.15% in Jun 2024
YoY Growth in year ended Jun 2025 is -77.55% vs -12.82% in Jun 2024
About Tapestry, Inc.

Company Coordinates


