
Compare Tarai Foods with Similar Stocks
Dashboard
With a Negative Book Value, the company has a Weak Long Term Fundamental Strength
- Poor long term growth as Net Sales has grown by an annual rate of -100.00% and Operating profit at 0% over the last 5 years
- The company has a negative book value of Rs 3.12 crore
Flat results in Mar 26
Risky - Negative EBITDA
Below par performance in long term as well as near term
Stock DNA
Other Agricultural Products
INR 7 Cr (Micro Cap)
NA (Loss Making)
46
0.00%
-0.70
11.22%
-2.16
Total Returns (Price + Dividend) 
Tarai Foods for the last several years.
Risk Adjusted Returns v/s
Returns Beta

News
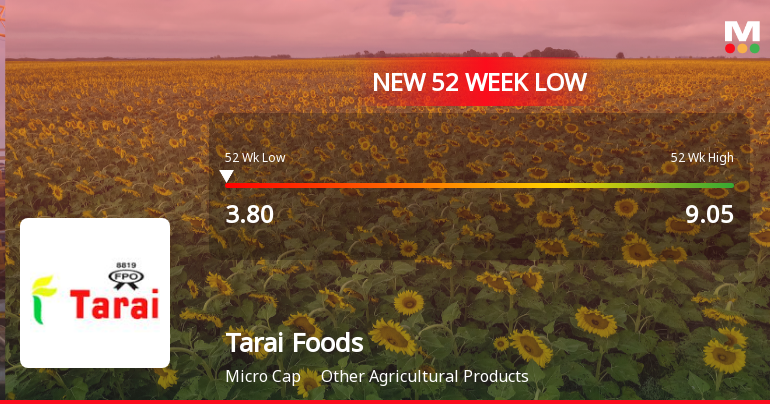
Markets Rally, But Tarai Foods Ltd Sinks to 52-Week Low in Stock-Specific Sell-Off
Despite a broadly positive market environment, Tarai Foods Ltd has slipped to a fresh 52-week low of Rs 3.8, marking a 55.81% decline over the past year and underscoring persistent headwinds for this micro-cap player in the Other Agricultural Products sector.
Read full news article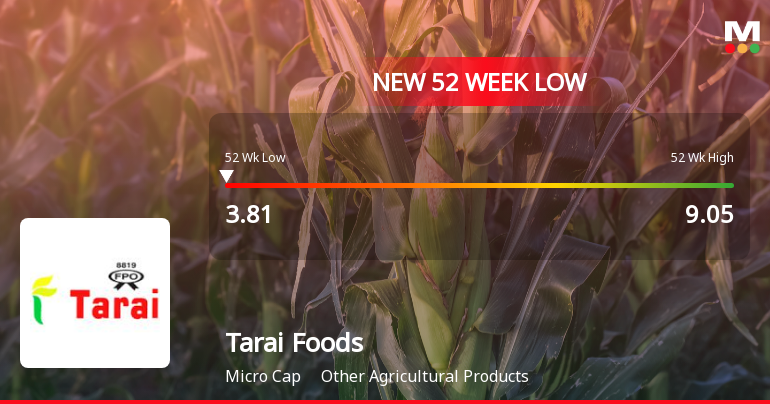
Markets Rally, But Tarai Foods Ltd Sinks to 52-Week Low in Stock-Specific Sell-Off
While the broader market indices have shown resilience, Tarai Foods Ltd has continued its downward trajectory, hitting a fresh 52-week low of Rs 3.81 on 16 Jul 2026. This decline comes amid persistent underperformance and a series of financial setbacks that have weighed heavily on investor sentiment.
Read full news article
Markets Rally, But Tarai Foods Ltd Sinks to 52-Week Low in Stock-Specific Sell-Off
While the broader market indices edged higher on 15 Jul 2026, Tarai Foods Ltd saw its share price fall to a fresh 52-week low of Rs 4, marking a decline of over 55% from its 52-week high of Rs 9.05. This stark underperformance contrasts sharply with the Sensex’s modest gains and highlights persistent challenges facing the company.
Read full news article Announcements
Board Meeting Outcome for Revised Outcome
06-Jul-2026 | Source : BSERevised outcome
Board Meeting Outcome for Outcome Of Board Meeting
30-May-2026 | Source : BSEDear Sir/ Madam Please find attached the outcome of the board meeting held on 30.05.2026
Compliances-Reg.24(A)-Annual Secretarial Compliance
28-May-2026 | Source : BSERespected Sir/Madam Please find attached the Annual Secretarial Compliance Report for the year ended 31.03.2026 for your kind perusal and consideration. Regards
Corporate Actions

No Upcoming Board Meetings

No Dividend history available

No Splits history available

No Bonus history available

No Rights history available
Quality key factors
Valuation key factors
Technicals key factors
 Technical Indicator Scale: Bearish, Mildly Bearish, Sideways, Mildly Bullish, Bullish Turned
 Shareholding Snapshot : Mar 2026
Shareholding Compare (%holding)
Non Institution
None
Held by 6 Schemes (0.07%)
Held by 0 FIIs
Galway Investments Private Limited (35.7%)
Sunbright Foods Pvt Ltd. (5.64%)
30.53%
Quarterly Results Snapshot (Standalone) - Mar'26 - QoQ
QoQ Growth in quarter ended Mar 2026 is 0.00% vs 0.00% in Dec 2025

QoQ Growth in quarter ended Mar 2026 is 54.55% vs 0.00% in Dec 2025
Half Yearly Results Snapshot (Standalone) - Mar'19

Growth in half year ended Mar 2019 is -38.93% vs 36.70% in Sep 2018
Growth in half year ended Mar 2019 is 14,889.47% vs 235.71% in Sep 2018
Nine Monthly Results Snapshot (Standalone) - Dec'18
YoY Growth in nine months ended Dec 2018 is 14.77% vs -29.60% in Dec 2017
YoY Growth in nine months ended Dec 2018 is 1,300.00% vs -100.71% in Dec 2017
Annual Results Snapshot (Standalone) - Mar'26
YoY Growth in year ended Mar 2026 is 0.00% vs 0.00% in Mar 2025
YoY Growth in year ended Mar 2026 is -125.00% vs 35.48% in Mar 2025
About Tarai Foods Ltd

Company Coordinates


