
Compare TARC Ltd with Similar Stocks
Dashboard
With a Operating Losses, the company has a Weak Long Term Fundamental Strength
- Low ability to service debt as the company has a high Debt to EBITDA ratio of -7.17 times
- The company has been able to generate a Return on Equity (avg) of 0.66% signifying low profitability per unit of shareholders funds
Risky - Negative EBITDA
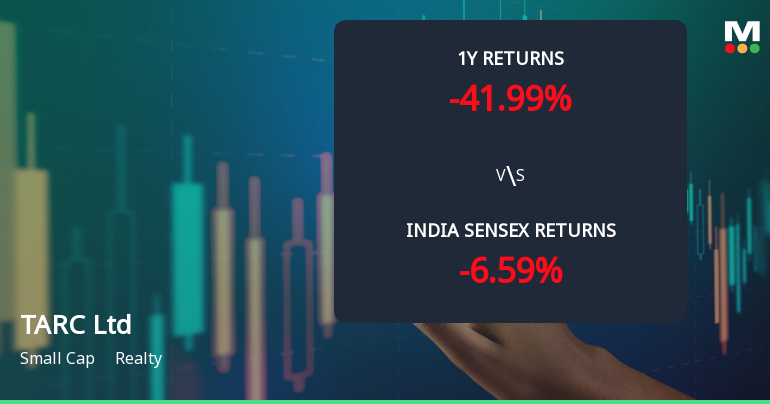
Underperformed the market in the last 1 year
Total Returns (Price + Dividend) 
TARC Ltd for the last several years.
Risk Adjusted Returns v/s
Returns Beta

News
TARC Ltd Technical Momentum Shifts Amid Bearish Outlook in Realty Sector
TARC Ltd, a small-cap player in the Realty sector, has experienced a marked deterioration in its technical outlook, with key momentum indicators signalling a shift from mildly bearish to outright bearish. The company’s share price has declined to ₹118.05, down 2.60% on the day, reflecting growing investor caution amid a challenging market environment and subdued sectoral sentiment.
Read full news article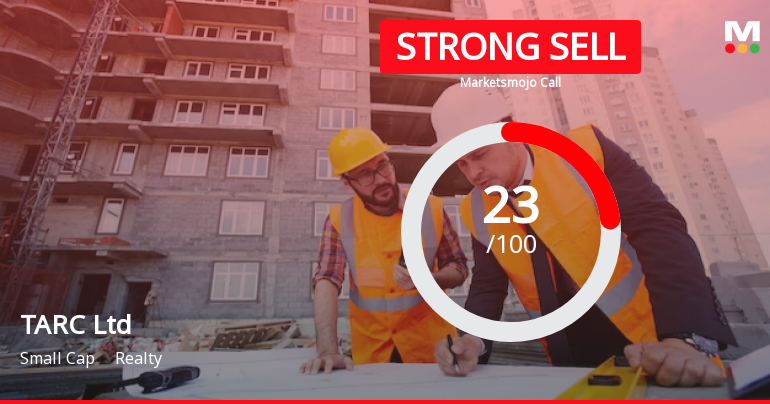
TARC Ltd is Rated Strong Sell
TARC Ltd is rated Strong Sell by MarketsMOJO, with this rating last updated on 13 January 2026. However, the analysis and financial metrics discussed here reflect the company’s current position as of 10 July 2026, providing investors with an up-to-date view of the stock’s fundamentals, valuation, financial trends, and technical outlook.
Read full news article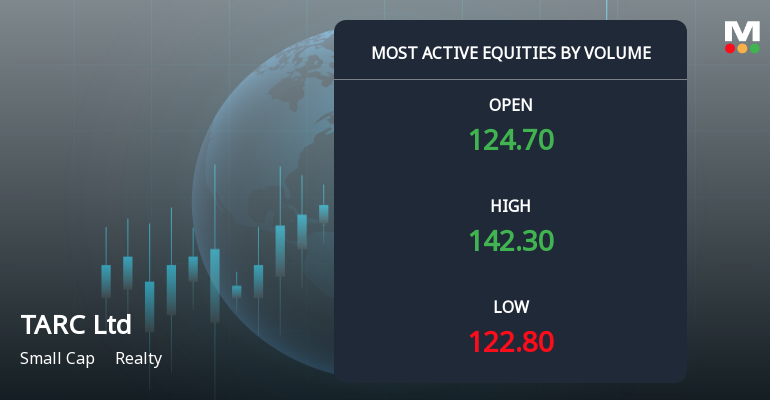
TARC Ltd Sees Exceptional Volume Surge Amid Mixed Technical Signals
TARC Ltd, a small-cap player in the Realty sector, witnessed one of the highest trading volumes on 7 July 2026, with over 2.83 crore shares exchanging hands. The stock surged 6.3% intraday, outperforming its sector by 6.64%, signalling renewed investor interest despite a recent downgrade to a Strong Sell rating by MarketsMOJO.
Read full news article Announcements
Compliances-Certificate under Reg. 74 (5) of SEBI (DP) Regulations 2018
14-Jul-2026 | Source : BSECertificate under Regulation 74(5) of SEBI (Depository and Participants) Regulations 2018
Announcement under Regulation 30 (LODR)-Change in Management
09-Jul-2026 | Source : BSEIntimation under Regulation 30 of SEBI (LODR) Regulations 2015
Announcement under Regulation 30 (LODR)-Press Release / Media Release
07-Jul-2026 | Source : BSEPress Release
Corporate Actions

No Upcoming Board Meetings

No Dividend history available

No Splits history available

No Bonus history available

No Rights history available
Quality key factors
Valuation key factors
Technicals key factors
 Technical Indicator Scale: Bearish, Mildly Bearish, Sideways, Mildly Bullish, Bullish Turned
 Shareholding Snapshot : Jun 2026
Shareholding Compare (%holding)
Promoters
None
Held by 7 Schemes (6.43%)
Held by 40 FIIs (0.99%)
Anil Sarin (33.48%)
Bandhan Small Cap Fund (5.25%)
17.84%
Quarterly Results Snapshot (Consolidated) - Mar'26 - QoQ

QoQ Growth in quarter ended Mar 2026 is 443.77% vs 458.66% in Dec 2025

QoQ Growth in quarter ended Mar 2026 is 107.70% vs -33.44% in Dec 2025
Half Yearly Results Snapshot (Consolidated) - Sep'25
Growth in half year ended Sep 2025 is 560.57% vs -86.48% in Sep 2024
Growth in half year ended Sep 2025 is 139.26% vs -1,296.83% in Sep 2024
Nine Monthly Results Snapshot (Consolidated) - Dec'25
YoY Growth in nine months ended Dec 2025 is 453.70% vs -78.54% in Dec 2024
YoY Growth in nine months ended Dec 2025 is 113.77% vs -400.75% in Dec 2024
Annual Results Snapshot (Consolidated) - Mar'26
YoY Growth in year ended Mar 2026 is 879.04% vs -69.77% in Mar 2025
YoY Growth in year ended Mar 2026 is 108.25% vs -200.09% in Mar 2025
About TARC Ltd

Company Coordinates


