
Compare Tarmat with Similar Stocks
Dashboard
Weak Long Term Fundamental Strength with a -0.46% CAGR growth in Operating Profits over the last 5 years
- The company has been able to generate a Return on Equity (avg) of 2.86% signifying low profitability per unit of shareholders funds
Consistent Underperformance against the benchmark over the last 3 years
Total Returns (Price + Dividend) 
Latest dividend: 1 per share ex-dividend date: Sep-20-2010
Risk Adjusted Returns v/s
Returns Beta

News
Are Tarmat Ltd latest results good or bad?
Tarmat Ltd's latest financial results for Q4 FY26 indicate significant operational developments. The company reported a net profit of ₹2.96 crores, reflecting a substantial year-on-year growth of 419.30%. Revenue for the same quarter reached ₹42.46 crores, marking a 12.36% increase compared to the previous year. Notably, this revenue figure also represents a 55.47% sequential growth from the preceding quarter, indicating strong momentum in sales. The operating margin improved to 6.83%, which is the highest recorded to date, showcasing enhanced efficiency in project execution and cost management. The profit after tax margin also saw a notable rise, reaching 6.97%, up from 1.51% in the same quarter last year. Despite these positive operational metrics, Tarmat's stock has faced challenges, declining 8.29% over the past year, while the broader construction sector has seen gains. The company's valuation metric...
Read full news article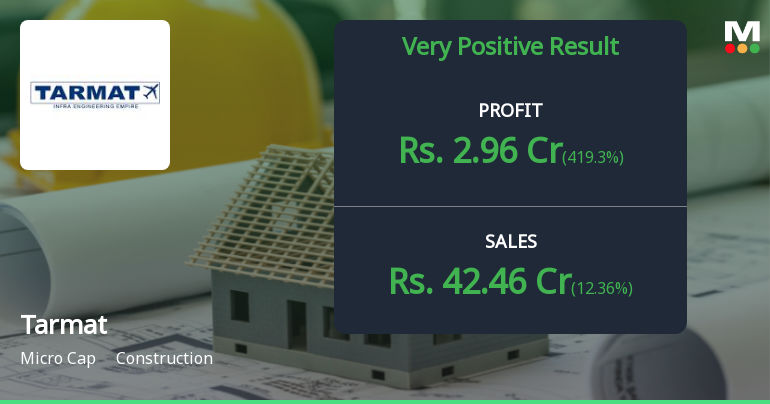
Tarmat Ltd Q4 FY26: Stellar Profit Surge Masks Underlying Profitability Concerns
Tarmat Limited, a Mumbai-based construction company with a market capitalisation of ₹134.00 crores, reported a remarkable 419.30% year-on-year surge in consolidated net profit to ₹2.96 crores for Q4 FY26, driven by robust revenue growth and improved operational efficiency. However, the micro-cap stock continues to trade in mildly bearish territory at ₹52.45, down 29.03% from its 52-week high, as investors grapple with the company's historically weak profitability metrics and challenging long-term fundamentals.
Read full news article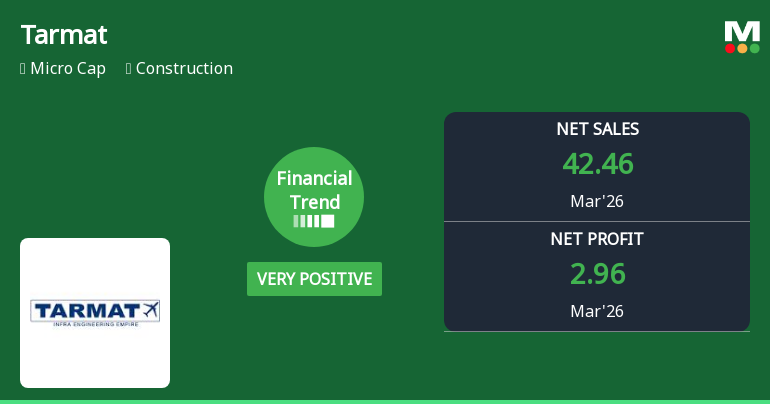
Tarmat Ltd Reports Very Positive Quarterly Financial Performance Amid Mixed Long-Term Returns
Tarmat Ltd, a micro-cap player in the construction sector, has demonstrated a remarkable turnaround in its financial performance for the quarter ended March 2026. The company’s financial trend rating has improved significantly, reflecting its highest-ever quarterly revenue and profit metrics, signalling a potential shift in its market trajectory despite lingering challenges in its longer-term returns.
Read full news article Announcements
Announcement under Regulation 30 (LODR)-Newspaper Publication
01-Jun-2026 | Source : BSEIn compliance with regulation 47 of SEBI (LODR) Regulations 2015 please find enclosed Audited Financial Results of the Company for the quarter and year ended 31.03.2026 published in (1) Active Times ( English ) and Mumbai Lakshdeep (Marathi)
Board Meeting Outcome for Outcome Of Board Meeting And Submission Of Audited Standalone And Consolidated Financial Results Of The Company For The Quarter And Financial Year Ended 31St March 2026.
30-May-2026 | Source : BSEIn terms of Regulation 30 of the Securities and Exchange Board of India (Listing Obligations and Disclosure Requirements) Regulations 2015 we wish to inform that the Board of Directors of the Company has at its meeting held today i.e. Saturday May 30 2026 inter alia considered and unanimously approved the Audited Financial Statements (Standalone and Consolidated) of the Company for the year ended March 31 2026 and Audited Financial Results (Standalone and Consolidated) of the Company for the year and quarter ended March 312026 under Ind AS (the Statement). (Statements/ Results & Auditors Report issued thereon enclosed).
Submission Of Audited Standalone And Consolidated Financial Results For The Quarter And Year Ended 31.03.2026
30-May-2026 | Source : BSEIn terms of Regulation 30 of the SEBI (LODR) Regulation 2015 ................. Audited Results attached
Corporate Actions

No Upcoming Board Meetings

Tarmat Ltd has declared 10% dividend, ex-date: 20 Sep 10

No Splits history available

No Bonus history available

No Rights history available
Quality key factors
Valuation key factors
Technicals key factors
 Technical Indicator Scale: Bearish, Mildly Bearish, Sideways, Mildly Bullish, Bullish Turned
 Shareholding Snapshot : Mar 2026
Shareholding Compare (%holding)
Non Institution
None
Held by 0 Schemes
Held by 3 FIIs (1.8%)
Jerry Varghese (13.24%)
Yash Jayesh Mehta (7.47%)
32.13%
Quarterly Results Snapshot (Consolidated) - Mar'26 - YoY

YoY Growth in quarter ended Mar 2026 is 12.36% vs 82.74% in Mar 2025

YoY Growth in quarter ended Mar 2026 is 419.30% vs 124.36% in Mar 2025
Half Yearly Results Snapshot (Consolidated) - Sep'25
Growth in half year ended Sep 2025 is 27.44% vs -18.77% in Sep 2024
Growth in half year ended Sep 2025 is 125.00% vs -11.11% in Sep 2024
Nine Monthly Results Snapshot (Consolidated) - Dec'25
YoY Growth in nine months ended Dec 2025 is 17.99% vs -7.56% in Dec 2024
YoY Growth in nine months ended Dec 2025 is 153.08% vs 8.33% in Dec 2024
Annual Results Snapshot (Consolidated) - Mar'26
YoY Growth in year ended Mar 2026 is 15.89% vs 13.35% in Mar 2025
YoY Growth in year ended Mar 2026 is 233.69% vs 265.49% in Mar 2025
About Tarmat Ltd

Company Coordinates


