
Compare Tata Technolog. with Similar Stocks
Stock DNA
Computers - Software & Consulting
INR 30,373 Cr (Small Cap)
54.00
21
1.55%
-0.15
14.11%
7.78
Total Returns (Price + Dividend) 
Latest dividend: 8.34 per share ex-dividend date: Jun-18-2026
Risk Adjusted Returns v/s
Returns Beta

News

Tata Technologies Ltd is Rated Buy
Tata Technologies Ltd is rated Buy by MarketsMOJO, with this rating last updated on 17 July 2026. However, the analysis and financial metrics discussed here reflect the stock’s current position as of 28 July 2026, providing investors with the most up-to-date view of the company’s fundamentals, returns, and market standing.
Read full news article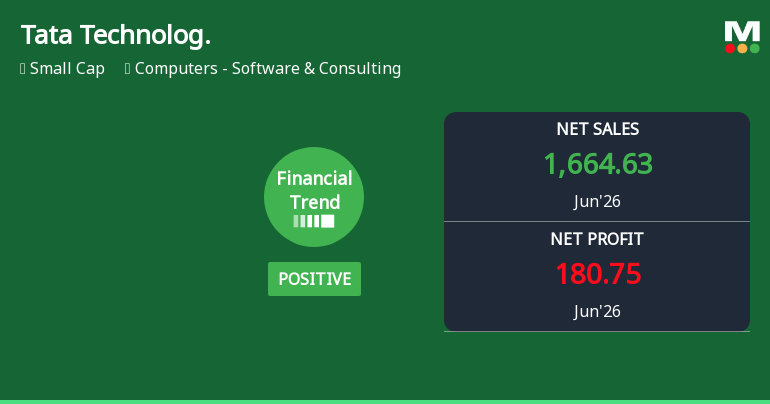
Tata Technologies Ltd Reports Strong Quarterly Growth, Upgrades Financial Outlook
Tata Technologies Ltd has demonstrated a marked improvement in its financial performance for the quarter ended June 2026, prompting an upgrade in its investment rating from Hold to Buy. The company’s recent quarterly results reveal robust revenue growth and margin expansion, signalling a positive shift in its financial trend after a period of stagnation.
Read full news articleAre Tata Technologies Ltd latest results good or bad?
Tata Technologies Ltd reported its financial results for Q1 FY27, showcasing a complex operational landscape. The company achieved a record net sales figure of ₹1,664.63 crores, reflecting a year-on-year revenue growth of 33.78% and a sequential increase of 5.88%. This strong topline performance indicates robust demand for its engineering and product development services. However, the profitability metrics reveal challenges. The net profit for the quarter was ₹180.75 crores, which represents a decline of 11.47% compared to the previous quarter, despite a modest year-on-year growth of 6.15%. The PAT margin contracted to 10.86%, down from 12.99% in the prior quarter, highlighting pressures on operational efficiency. Operating margins, excluding other income, remained stable at 16.07%, slightly above the previous quarter's 16.04%. Yet, this is significantly lower than the 18.16% achieved in the same quarter ...
Read full news article Announcements
Corporate Actions

No Upcoming Board Meetings

Tata Technologies Ltd has declared 417% dividend, ex-date: 18 Jun 26

No Splits history available

No Bonus history available

No Rights history available
Quality key factors
Valuation key factors
Technicals key factors
 Technical Indicator Scale: Bearish, Mildly Bearish, Sideways, Mildly Bullish, Bullish Turned
 Shareholding Snapshot : Jun 2026
Shareholding Compare (%holding)
Promoters
None
Held by 21 Schemes (2.15%)
Held by 163 FIIs (6.3%)
Tata Motors Passenger Vehicles Limited (formerly Tata Motors Limited) (53.35%)
Tata Enterprises Overseas Limited (1.74%)
25.44%
Quarterly Results Snapshot (Consolidated) - Jun'26 - QoQ

QoQ Growth in quarter ended Jun 2026 is 5.88% vs 15.12% in Mar 2026
QoQ Growth in quarter ended Jun 2026 is -11.47% vs 2,974.85% in Mar 2026
Half Yearly Results Snapshot (Consolidated) - Sep'25
Growth in half year ended Sep 2025 is 0.09% vs 1.53% in Sep 2024

Growth in half year ended Sep 2025 is 5.12% vs -9.23% in Sep 2024
Nine Monthly Results Snapshot (Consolidated) - Dec'25
YoY Growth in nine months ended Dec 2025 is 1.30% vs 1.75% in Dec 2024
YoY Growth in nine months ended Dec 2025 is -29.84% vs -6.52% in Dec 2024
Annual Results Snapshot (Consolidated) - Mar'26
YoY Growth in year ended Mar 2026 is 6.52% vs 1.00% in Mar 2025
YoY Growth in year ended Mar 2026 is -19.26% vs -0.36% in Mar 2025
About Tata Technologies Ltd

Company Coordinates


