
Compare Tata Tele. Mah. with Similar Stocks
Dashboard
With a Negative Book Value, the company has a Weak Long Term Fundamental Strength
- Poor long term growth as Net Sales has grown by an annual rate of 2.14% and Operating profit at 0% over the last 5 years
- The company has a negative book value of Rs 19,983.38 crore
Risky - Negative Book Value
Despite the size of the company, domestic mutual funds hold only 0.61% of the company
Consistent Underperformance against the benchmark over the last 3 years
Stock DNA
Telecom - Services
INR 8,162 Cr (Small Cap)
NA (Loss Making)
39
0.00%
-1.04
4.35%
-0.41
Total Returns (Price + Dividend) 
Tata Tele. Mah. for the last several years.
Risk Adjusted Returns v/s
Returns Beta

News

Tata Teleservices (Maharashtra) Ltd is Rated Strong Sell
Tata Teleservices (Maharashtra) Ltd is rated Strong Sell by MarketsMOJO. This rating was last updated on 01 Oct 2024, reflecting a reassessment of the company’s outlook. However, the analysis and financial metrics presented here are based on the stock’s current position as of 11 May 2026, providing investors with the latest insights into its performance and fundamentals.
Read full news article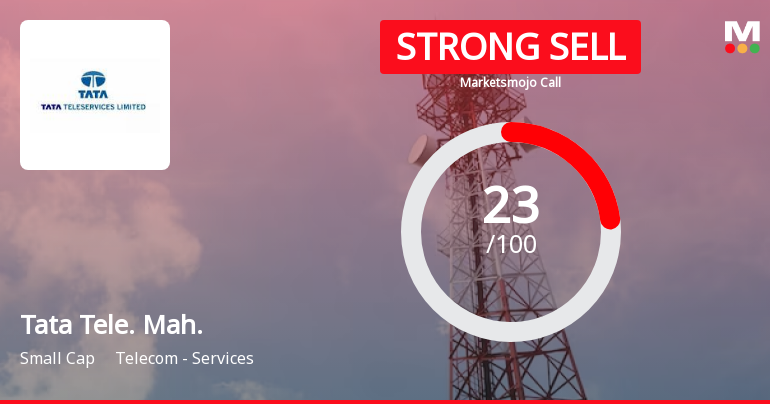
Tata Teleservices (Maharashtra) Ltd is Rated Strong Sell
Tata Teleservices (Maharashtra) Ltd is rated Strong Sell by MarketsMOJO. This rating was last updated on 01 Oct 2024, but the analysis and financial metrics presented here reflect the stock's current position as of 30 April 2026.
Read full news article
Tata Teleservices (Maharashtra) Ltd Reports Flat Quarterly Performance Amid Margin Pressures
Tata Teleservices (Maharashtra) Ltd has reported a flat financial performance for the quarter ended March 2026, signalling a pause in its previously positive growth trajectory. Despite some operational improvements, the company’s financial trend score has declined sharply, reflecting challenges in sustaining revenue growth and margin expansion in a competitive telecom services sector.
Read full news article Announcements
Announcement under Regulation 30 (LODR)-Newspaper Publication
15-May-2026 | Source : BSENewspaper advertisement informing about e-Voting details procedure for registering email address and 31st AGM of the Company.
Reg. 34 (1) Annual Report.
13-May-2026 | Source : BSEPlease see attached 31st Annual Report of the Company for the financial year 2025-2026 alongwith the notice of the AGM and other statutory reports.
Business Responsibility and Sustainability Reporting (BRSR)
13-May-2026 | Source : BSEPlease see attached report of BRSR of the Company for the financial year ended March 31 2026
Corporate Actions

No Upcoming Board Meetings

No Dividend history available

No Splits history available

Tata Teleservices (Maharashtra) Ltd has announced 2:15 bonus issue, ex-date: 07 Aug 13

Tata Teleservices (Maharashtra) Ltd has announced 19:100 rights issue, ex-date: 19 Oct 06
Quality key factors
Valuation key factors
Technicals key factors
 Technical Indicator Scale: Bearish, Mildly Bearish, Sideways, Mildly Bullish, Bullish Turned
 Shareholding Snapshot : Mar 2026
Shareholding Compare (%holding)
Promoters
None
Held by 15 Schemes (0.16%)
Held by 79 FIIs (2.6%)
Tata Teleservices Limited (48.3%)
None
20.9%
Quarterly Results Snapshot (Standalone) - Mar'26 - QoQ

QoQ Growth in quarter ended Mar 2026 is 0.42% vs 2.86% in Dec 2025

QoQ Growth in quarter ended Mar 2026 is 486.18% vs 53.11% in Dec 2025
Half Yearly Results Snapshot (Standalone) - Sep'25
Growth in half year ended Sep 2025 is -14.49% vs 16.54% in Sep 2024
Growth in half year ended Sep 2025 is 1.22% vs -6.93% in Sep 2024
Nine Monthly Results Snapshot (Standalone) - Dec'25
YoY Growth in nine months ended Dec 2025 is -13.51% vs 15.13% in Dec 2024
YoY Growth in nine months ended Dec 2025 is 17.82% vs -5.42% in Dec 2024
Annual Results Snapshot (Standalone) - Mar'26
YoY Growth in year ended Mar 2026 is -11.30% vs 9.77% in Mar 2025
YoY Growth in year ended Mar 2026 is 83.12% vs -3.82% in Mar 2025
About Tata Teleservices (Maharashtra) Ltd

Company Coordinates


