
Compare Taylormade Renew with Similar Stocks
Stock DNA
Industrial Manufacturing
INR 102 Cr (Micro Cap)
56.00
55
0.00%
0.21
1.89%
1.05
Total Returns (Price + Dividend) 
Taylormade Renew for the last several years.
Risk Adjusted Returns v/s
Returns Beta

News

Taylormade Renewables Ltd Falls to 52-Week Low of Rs 73.77 as Sell-Off Deepens
For the third consecutive session, Taylormade Renewables Ltd has closed lower, culminating in a fresh 52-week low of Rs 73.77 on 21 Jul 2026. This marks a steep decline of nearly 71% over the past year, sharply underperforming the Sensex’s modest 5.8% fall during the same period.
Read full news article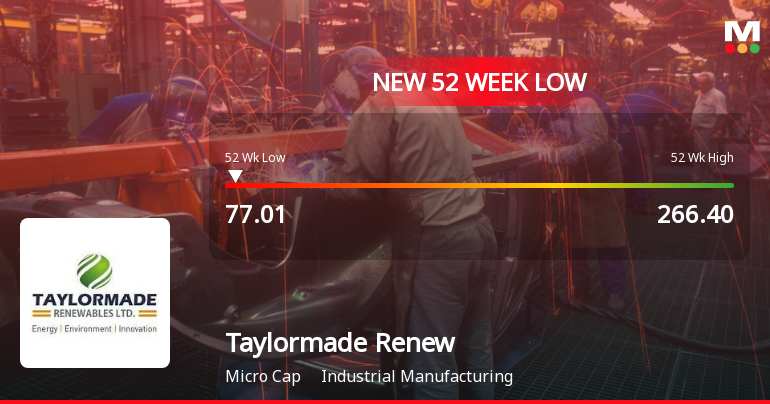
Taylormade Renewables Ltd Falls to 52-Week Low of Rs 77.01 as Sell-Off Deepens
A sharp decline has pushed Taylormade Renewables Ltd to a fresh 52-week low of Rs 77.01 on 20 Jul 2026, marking a significant 69.08% drop over the past year and underscoring persistent headwinds for the micro-cap industrial manufacturer.
Read full news article
Taylormade Renewables Ltd is Rated Strong Sell
Taylormade Renewables Ltd is rated Strong Sell by MarketsMOJO, with this rating last updated on 01 June 2026. However, the analysis and financial metrics discussed here reflect the stock’s current position as of 20 July 2026, providing investors with the latest insights into the company’s performance and outlook.
Read full news article Announcements
Closure of Trading Window
29-Jun-2026 | Source : BSEIntimation of Closure of Trading window
Board Meeting Outcome for Outcome Of Board Meeting
26-Jun-2026 | Source : BSEAllotment of 1000000 warrants to persons belonging to Non - promoter Category
Announcement under Regulation 30 (LODR)-Newspaper Publication
05-Jun-2026 | Source : BSENewspaper Extracts of Audited Financial Results for year ended on March 31 2026
Corporate Actions

No Upcoming Board Meetings

No Dividend history available

No Splits history available

No Bonus history available

No Rights history available
Quality key factors
Valuation key factors
Technicals key factors
 Technical Indicator Scale: Bearish, Mildly Bearish, Sideways, Mildly Bullish, Bullish Turned
 Shareholding Snapshot : Mar 2026
Shareholding Compare (%holding)
Promoters
None
Held by 0 Schemes
Held by 0 FIIs
Dharmendra Sharad Gor (50.6%)
Chandrasekar . (3.23%)
37.37%
Quarterly Results Snapshot (Consolidated) - Mar'26 - YoY

YoY Growth in quarter ended Mar 2026 is 7.77% vs -3.74% in Mar 2025

YoY Growth in quarter ended Mar 2026 is -47.10% vs -37.90% in Mar 2025
Half Yearly Results Snapshot (Standalone) - Sep'25
Growth in half year ended Sep 2025 is -80.22% vs 68.78% in Sep 2024
Growth in half year ended Sep 2025 is -231.78% vs 59.77% in Sep 2024
Nine Monthly Results Snapshot (Standalone) - Dec'25
YoY Growth in nine months ended Dec 2025 is -57.15% vs 36.69% in Dec 2024
YoY Growth in nine months ended Dec 2025 is -127.98% vs -47.11% in Dec 2024
Annual Results Snapshot (Consolidated) - Mar'26
YoY Growth in year ended Mar 2026 is -31.94% vs 51.68% in Mar 2025
YoY Growth in year ended Mar 2026 is -85.22% vs 11.10% in Mar 2025
About Taylormade Renewables Ltd

Company Coordinates


