
Compare Taylormade Renew with Similar Stocks
Stock DNA
Industrial Manufacturing
INR 114 Cr (Micro Cap)
62.00
58
0.00%
0.21
1.89%
1.16
Total Returns (Price + Dividend) 
Taylormade Renew for the last several years.
Risk Adjusted Returns v/s
Returns Beta

News

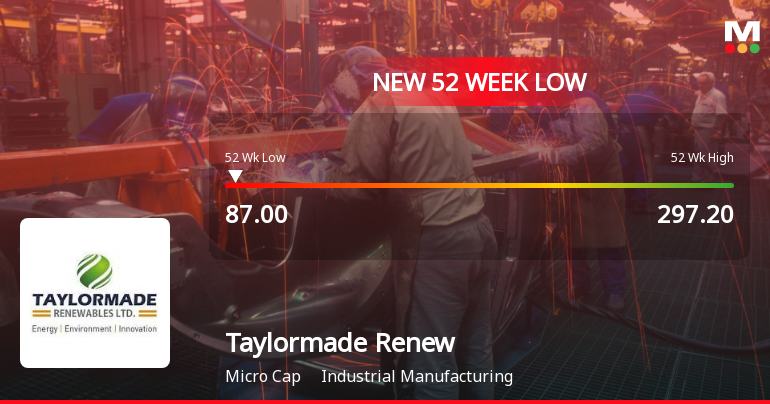
Taylormade Renewables Ltd Falls to 52-Week Low of Rs 87 as Sell-Off Deepens
For the third consecutive session, Taylormade Renewables Ltd has closed lower, culminating in a fresh 52-week low of Rs 87 on 3 Jun 2026. This marks a significant 66.97% decline over the past year, sharply underperforming the Sensex's 8.39% fall during the same period.
Read full news articleAre Taylormade Renewables Ltd latest results good or bad?
The latest financial results for Taylormade Renewables Ltd indicate a complex operational landscape. In the quarter ending March 2026, the company reported net sales of ₹21.35 crores, reflecting a year-on-year growth of 7.77%. This marks a recovery from previous quarters, particularly following a challenging September 2025 quarter that saw negative sales. However, despite this stabilization in revenue, the net profit for the same period was ₹3.38 crores, which represents a significant decline of 47.10% year-on-year. This decline raises concerns about the company's profitability trajectory. The operating profit margin, excluding other income, fell dramatically to 11.01%, down from 51.79% in the previous year, indicating severe margin compression. This suggests that the company is grappling with either intense pricing pressures or rising operational costs that it has not been able to manage effectively. The ...
Read full news article Announcements
Announcement under Regulation 30 (LODR)-Newspaper Publication
05-Jun-2026 | Source : BSENewspaper Extracts of Audited Financial Results for year ended on March 31 2026
Announcement under Regulation 30 (LODR)-Press Release / Media Release
02-Jun-2026 | Source : BSETaylormade Renewables Limited announces FY 2025-26 Results
Board Meeting Outcome for Outcome Of Board Meeting Held On May 30 2026- Audited Financial Results For The Year Ended As On March 31 2026
31-May-2026 | Source : BSEAudited Financial Results for the year ended as on March 31 2026
Corporate Actions

No Upcoming Board Meetings

No Dividend history available

No Splits history available

No Bonus history available

No Rights history available
Quality key factors
Valuation key factors
Technicals key factors
 Technical Indicator Scale: Bearish, Mildly Bearish, Sideways, Mildly Bullish, Bullish Turned
 Shareholding Snapshot : Mar 2026
Shareholding Compare (%holding)
Promoters
None
Held by 0 Schemes
Held by 0 FIIs
Dharmendra Sharad Gor (50.6%)
Chandrasekar . (3.23%)
37.37%
Quarterly Results Snapshot (Consolidated) - Mar'26 - YoY

YoY Growth in quarter ended Mar 2026 is 7.77% vs -3.74% in Mar 2025

YoY Growth in quarter ended Mar 2026 is -47.10% vs -37.90% in Mar 2025
Half Yearly Results Snapshot (Standalone) - Sep'25
Growth in half year ended Sep 2025 is -80.22% vs 68.78% in Sep 2024
Growth in half year ended Sep 2025 is -231.78% vs 59.77% in Sep 2024
Nine Monthly Results Snapshot (Standalone) - Dec'25
YoY Growth in nine months ended Dec 2025 is -57.15% vs 36.69% in Dec 2024
YoY Growth in nine months ended Dec 2025 is -127.98% vs -47.11% in Dec 2024
Annual Results Snapshot (Consolidated) - Mar'26
YoY Growth in year ended Mar 2026 is -31.94% vs 51.68% in Mar 2025
YoY Growth in year ended Mar 2026 is -85.22% vs 11.10% in Mar 2025
About Taylormade Renewables Ltd

Company Coordinates


