TCPL Packaging

  • Market Cap: Small Cap
  • Industry: Packaging
  • ISIN: INE822C01015
  • NSEID: TCPLPACK
  • BSEID: 523301
INR
3,901.50
38.3 (0.99%)
BSENSE

Sep 21, 03:30 PM

BSE+NSE Vol: 5.58 k

  • Price Points
  • Score
  • Mojo Parameters
  • Total Return
  • News and Corporate Actions
  • Key factors
  • Shareholding
  • Financials
  • CompanyCV
stock-summaryPrice Point
High/Low

1Day

52 Week

Valuation
Technical
Day's Volume

CASH

5.58 k (-14.60%) Volume

Shareholding (Jun 2026)

FII

1.02%

Held by 27 FIIs

DII

13.69%

Held by 8 DIIs

Promoter

55.74%

Why is TCPL Packaging Ltd. falling/rising?

06-Sep-2026

As of 05-Sep, TCPL Packaging Ltd. is seeing a stock price increase to 4,088.60, up 3.51%, driven by strong performance metrics and outpacing the Sensex. The stock has risen 35.42% year-to-date, supported by high management efficiency and consistent returns, despite a decline in delivery volume.

As of 05-Sep, TCPL Packaging Ltd. is experiencing a rise in its stock price, currently at 4,088.60, reflecting an increase of 138.75 or 3.51%. This upward movement can be attributed to several key factors. Over the past week, the stock has outperformed the Sensex, gaining 7.85% compared to the index's decline of 0.97%. Additionally, the stock has shown impressive performance over the past month, with a 26.72% increase while the Sensex fell by 2.44%. Year-to-date, TCPL Packaging has risen by 35.42%, significantly outperforming the Sensex, which has decreased by 10.21%.<BR><BR>Today's trading session has also seen the stock outperform its sector by 3.92%, reaching an intraday high of Rs 4,127, which is a 4.48% increase. Furthermore, TCPL Packaging is trading above its moving averages across various time frames, indicating a strong bullish trend. The company has demonstrated high management efficiency, with a return on capital employed (ROCE) of 16.29% and strong operating cash flow, which reached its highest at Rs 271.30 crore.<BR><BR>Despite a noted decline in delivery volume, which fell by 38.95% against the 5-day average, the overall positive performance metrics and consistent returns over the last three years contribute to the stock's rising price. The majority ownership by promoters and the company's ability to generate consistent returns further bolster investor confidence, leading to the current upward trend in TCPL Packaging Ltd.'s stock price.

View full answer

Who are in the management team of TCPL Packaging?

01-Sep-2026

The management team of TCPL Packaging includes key members such as Saket Kanoria (Managing Director), K K Kanoria (Executive Chairman), and several independent directors, bringing diverse expertise to the company. Other notable members include Sudhir Merchant, S G Nanavati, and Harish Anchan (Company Secretary).

The management team of TCPL Packaging includes the following members:<BR><BR>1. **Atul Sud** - Independent Director<BR>2. **Saket Kanoria** - Managing Director<BR>3. **K K Kanoria** - Executive Chairman<BR>4. **Sudhir Merchant** - Independent Director<BR>5. **S G Nanavati** - Executive Director<BR>6. **Rishav Kanoria** - Director<BR>7. **Rabindra Jhunjhunwala** - Independent Director<BR>8. **Sunil Talati** - Independent Director<BR>9. **Harish Anchan** - Company Secretary & Compliance Officer<BR>10. **Akshay Kanoria** - Executive Director<BR>11. **Deepa Misra Harris** - Independent Director<BR>12. **Vidur Kanoria** - Executive Director<BR>13. **Andreas Blaschke** - Independent Director<BR>14. **Sanjiv Anand** - Additional Director<BR><BR>This team brings a diverse range of expertise and leadership to the company.

View full answer

What does TCPL Packaging do?

01-Sep-2026

TCPL Packaging Ltd. is a leading Indian manufacturer of folding cartons and paperboard converters, with a market capitalization of INR 3,479 Cr. As of June 2026, it reported net sales of 493 Cr and a net profit of 40 Cr.

Overview: <BR>TCPL Packaging Ltd. is one of India's largest folding carton manufacturers and converters of paperboard, operating in the packaging industry within the small-cap market segment.<BR><BR>History: <BR>TCPL Packaging Limited was incorporated in August 1987 and was formerly known as Twenty-First Century Printers Limited until its name change in September 2008. The latest quarterly results reported net sales and net profit for June 2026.<BR><BR>Financial Snapshot: <BR>Most recent Net Sales: 493 Cr (Quarterly Results - Jun 2026) <BR>Most recent Net Profit: 40 Cr (Quarterly Results - Jun 2026) <BR>Market-cap value: INR 3,479 Cr (Small Cap)<BR><BR>Key Metrics: <BR>P/E: 28.00 <BR>Industry P/E: 18 <BR>Dividend Yield: 0.66% <BR>Debt-Equity: 0.85 <BR>Return on Equity: 14.92% <BR>Price to Book: 4.80 <BR><BR>Contact Details: <BR>Address: Empire Mills Complex, 414 S B Marg Lower Parel (W) Mumbai Maharashtra : 400013 <BR>Tel: 91-22-61646000 <BR>Email: info@tcpl.in <BR>Website: http://www.tcpl.in

View full answer

Who are the peers of the TCPL Packaging?

01-Sep-2026

TCPL Packaging's peers include EPL Ltd, AGI Greenpac, Uflex, Polyplex Corpn, Jindal Poly Film, XPRO India, Cosmo First, Mold-Tek Pack., and Huhtamaki India. Uflex has the highest 1-year return at 25.50%, while AGI Greenpac has the lowest at -12.66%; TCPL's return is 16.61%.

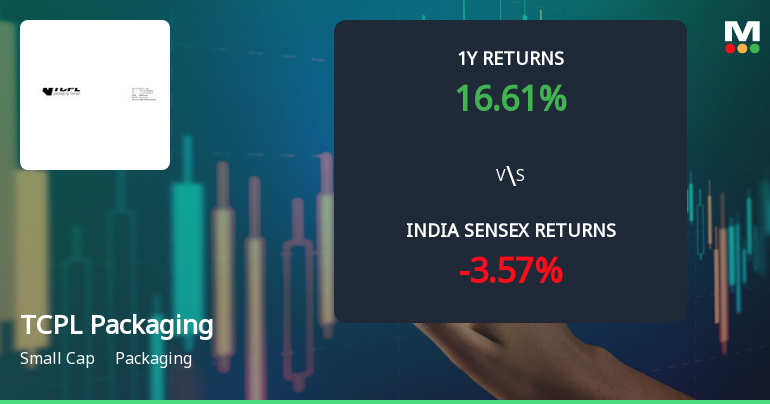
Peers: The peers of TCPL Packaging are EPL Ltd, AGI Greenpac, Uflex, Polyplex Corpn, Jindal Poly Film, XPRO India, Cosmo First, Mold-Tek Pack., and Huhtamaki India.<BR><BR>Quality Snapshot: Excellent management risk is observed at EPL Ltd, Mold-Tek Pack., and Polyplex Corpn, while Average management risk is found at AGI Greenpac, Uflex, Jindal Poly Film, XPRO India, Cosmo First, and Huhtamaki India, and the rest. Below Average management risk is present at Polyplex Corpn. Growth is below average across all peers, with the exception of Polyplex Corpn, which has excellent capital structure, while Jindal Poly Film and XPRO India also have excellent capital structures. The rest have average or below average capital structures.<BR><BR>Return Snapshot: The peer with the highest 1-year return is Uflex at 25.50%, while the lowest is AGI Greenpac at -12.66%. TCPL Packaging's own 1-year return is 16.61%, which is higher than AGI Greenpac but lower than Uflex. Additionally, Jindal Poly Film and XPRO India have negative six-month returns.

View full answer

How big is TCPL Packaging?

01-Sep-2026

As of 31st August, TCPL Packaging Ltd. has a market capitalization of 3,479.00 Cr, with net sales of 1,878.50 Cr and a net profit of 115.49 Cr reported in the latest four quarters. The company has shareholder's funds of 718.79 Cr and total assets of 1,716.16 Cr for the annual period ending March 2026.

As of 31st August, TCPL Packaging Ltd. has a market capitalization of 3,479.00 Cr, categorizing it as a Small Cap company.<BR><BR>In the latest four quarters, TCPL Packaging reported net sales of 1,878.50 Cr and a net profit of 115.49 Cr.<BR><BR>For the latest annual period ending March 2026, the company had shareholder's funds amounting to 718.79 Cr and total assets of 1,716.16 Cr.

View full answer

Should I buy, sell or hold TCPL Packaging Ltd.?

13-Aug-2026

When is the next results date for TCPL Packaging Ltd.?

30-Jul-2026

The next results date for TCPL Packaging Ltd. is 11 August 2026.

The next results date for TCPL Packaging Ltd. is scheduled for 11 August 2026.

View full answer

Are TCPL Packaging Ltd. latest results good or bad?

30-May-2026

TCPL Packaging Ltd.'s latest results are concerning, showing a 42.87% year-on-year decline in net profit despite a 7.45% revenue growth. The significant drop in profitability and compressed margins indicate serious operational challenges that the company needs to address.

The latest results for TCPL Packaging Ltd. present a mixed picture, but overall, they indicate significant challenges. In Q4 FY26, the company reported a net profit of ₹21.72 crores, which is a sharp decline of 42.87% year-on-year. This decline is concerning, especially as it follows a trend of decreasing profitability, with a 13.26% drop from the previous quarter.<BR><BR>While the company did achieve a revenue growth of 7.45% year-on-year, it experienced a sequential decline of 3.69% in net sales compared to the previous quarter. The profit after tax margin also compressed significantly to 4.79%, down from 9.0% in the same quarter last year, primarily due to an extraordinary increase in the effective tax rate to 46.01%, up from just 3.70% a year earlier.<BR><BR>The overall financial performance suggests that while there is some revenue growth, the underlying profitability is under severe pressure, driven by high tax burdens and margin compression. Additionally, the company's operating profit margin has also decreased, reflecting rising cost pressures that they have struggled to pass on to customers.<BR><BR>In summary, the latest results can be characterized as bad, particularly due to the substantial drop in net profit and the concerning trends in profitability and margins. The company faces significant operational challenges that need to be addressed to improve its financial health moving forward.

View full answer

Is TCPL Packaging technically bullish or bearish?

17-Nov-2025

As of November 14, 2025, TCPL Packaging's technical trend has shifted to a bearish stance, supported by bearish MACD, Bollinger Bands, and moving averages, indicating a negative outlook despite some mixed signals from the KST.

As of 14 November 2025, the technical trend for TCPL Packaging has changed from mildly bearish to bearish. The current stance is bearish with a moderate strength. Key indicators driving this assessment include a bearish MACD on the weekly timeframe, bearish Bollinger Bands on both weekly and monthly timeframes, and bearish moving averages on the daily timeframe. Additionally, the Dow Theory indicates a mildly bearish trend on both weekly and monthly levels, while the KST shows mixed signals with a mildly bullish weekly reading but a mildly bearish monthly reading. Overall, the technical indicators suggest a negative outlook for TCPL Packaging.

View full answer

How has been the historical performance of TCPL Packaging?

14-Nov-2025

TCPL Packaging has shown consistent growth in net sales and profitability, with net sales increasing from INR 889.78 crore in March 2020 to INR 1,770.25 crore in March 2025, and profit after tax rising from INR 36.52 crore to INR 143.01 crore during the same period. The company's earnings per share also surged from INR 40.13 to INR 157.15, reflecting improved shareholder value.

Answer:<BR>The historical performance of TCPL Packaging shows a consistent growth trajectory in net sales and profitability over the years.<BR><BR>Breakdown:<BR>TCPL Packaging's net sales have increased significantly from INR 889.78 crore in March 2020 to INR 1,770.25 crore in March 2025, reflecting a robust growth trend. The total operating income followed a similar pattern, rising from INR 889.78 crore in March 2020 to INR 1,770.25 crore in March 2025. The company's operating profit (PBDIT) also demonstrated strong growth, climbing from INR 128.09 crore in March 2020 to INR 307.42 crore in March 2025. Profit before tax increased from INR 42.29 crore in March 2020 to INR 173.68 crore in March 2025, while profit after tax rose from INR 36.52 crore to INR 143.01 crore during the same period. The earnings per share (EPS) surged from INR 40.13 in March 2020 to INR 157.15 in March 2025, indicating improved shareholder value. On the balance sheet, total assets grew from INR 838.20 crore in March 2021 to INR 1,611.78 crore in March 2025, with total liabilities also increasing from INR 763.80 crore to INR 1,611.78 crore. The cash flow from operating activities showed fluctuations, peaking at INR 233 crore in March 2024 before declining to INR 132 crore in March 2025. Overall, TCPL Packaging has exhibited strong financial performance with significant growth in sales, profits, and assets over the years.

View full answer

Is TCPL Packaging overvalued or undervalued?

12-Aug-2025

As of August 11, 2025, TCPL Packaging is fairly valued with a PE ratio of 23.50, an EV to EBITDA of 12.90, and a ROE of 22.21%, outperforming the Sensex with an 11.97% return over the past year.

As of 11 August 2025, TCPL Packaging's valuation grade has moved from expensive to fair, indicating a more favorable assessment of its market position. The company is currently fairly valued. Key ratios include a PE ratio of 23.50, an EV to EBITDA of 12.90, and a ROE of 22.21%. <BR><BR>In comparison with peers, TCPL Packaging's PE ratio is higher than Garware Hi Tech's 20.29 but lower than AGI Greenpac's 17.05, which is rated very attractive. Additionally, its PEG ratio of 0.99 suggests that the stock is reasonably priced relative to its growth expectations. Notably, TCPL Packaging has outperformed the Sensex over the past year with a return of 11.97% compared to the Sensex's 1.13%, reinforcing its valuation story.

View full answer

Who are the top shareholders of the TCPL Packaging?

17-Jul-2025

The top shareholders of TCPL Packaging include Accuraform Private Limited with 21.32%, individual investors with 25.29%, and mutual funds holding 7.47%. Notably, Anil Kumar Goel is a significant public shareholder with 7.69%, and there are no pledged promoter holdings.

The top shareholders of TCPL Packaging include a mix of promoters, mutual funds, and individual investors. The majority shareholders are the promoters, with Accuraform Private Limited holding the highest stake at 21.32%. In addition, individual investors collectively own 25.29% of the shares. Mutual funds have a presence as well, with three schemes holding a total of 7.47%. Among public shareholders, Anil Kumar Goel stands out with a holding of 7.69%. Overall, the company has a diverse shareholder base, with no pledged promoter holdings reported.

View full answer

Has TCPL Packaging declared dividend?

06-Jun-2025

Yes, TCPL Packaging Ltd. has declared a 220% dividend, amounting to ₹22 per share, with an ex-date of July 23, 2024. The company has demonstrated strong total returns across various periods, reflecting robust financial performance.

TCPL Packaging Ltd. has declared a 220% dividend.<BR><BR>Dividend Details:<BR>- Percentage announced: 220%<BR>- Amount per share: 22<BR>- Ex-date: 23 Jul 24<BR><BR>Dividend Yield: 0.58%.<BR><BR>Total Returns by Period:<BR>In the last 6 months, the price return was 15.68%, with no dividend return, resulting in a total return of 15.68%.<BR><BR>Over the past year, the price return was 78.91%, with a dividend return of 1.04%, leading to a total return of 79.95%.<BR><BR>In the 2-year period, the price return reached 150.38%, with a dividend return of 2.88%, culminating in a total return of 153.26%.<BR><BR>For the 3-year period, the price return was 320.89%, alongside a dividend return of 6.50%, which resulted in a total return of 327.39%.<BR><BR>In the last 4 years, the price return was 676.9%, with a dividend return of 12.23%, leading to a total return of 689.13%.<BR><BR>Over the past 5 years, the price return soared to 1424.19%, with a dividend return of 24.28%, resulting in an impressive total return of 1448.47%.<BR><BR>Overall, TCPL Packaging Ltd. has declared a significant dividend and has shown strong total returns across all periods, indicating robust financial performance and shareholder value enhancement.

View full answer
iScoreScore
Click here to find our call on this stock
Strong Sell
Sell
Hold
Buy
Strong Buy

Dashboard

1

High Management Efficiency with a high ROCE of 16.29%

 
2

Poor long term growth as Net Sales has grown by an annual rate of 14.36% and Operating profit at 19.96% over the last 5 years

3

With ROCE of 15.7, it has a Expensive valuation with a 3.1 Enterprise value to Capital Employed

4

Majority shareholders : Promoters

 
5

Consistent Returns over the last 3 years

stock-summaryMojo Parameters

Mojo Parameters

Loading Valuation Snapshot...

Stock DNA

stock-summary
Industry

Packaging

stock-summary
Market cap

INR 3,514 Cr (Small Cap)

stock-summary
P/E

28.00

stock-summary
Industry P/E

17

stock-summary
Dividend Yield

0.64%

stock-summary
Debt Equity

0.85

stock-summary
Return on Equity

14.92%

stock-summary
Price to Book

4.93

Revenue and Profits:
Net Sales:
493 Cr
(Quarterly Results - Jun 2026)
Net Profit:
40 Cr
stock-summaryTotal Returns
Total Returns (Price + Dividend) stock-summary
Dividend Yield (0.64%)
TimePeriod
Price Return
Dividend Return
Total Return
3 Months
28.91%
0.87%
29.78%
6 Months
66.19%
1.07%
67.26%
1 Year
13.04%
0.77%
13.81%
2 Years
12.03%
1.66%
13.69%
3 Years
86.57%
3.57%
90.14%
4 Years
247.7%
7.97%
255.67%
5 Years
641.38%
19.72%
661.1%

Latest dividend: 25.197981912185064 per share ex-dividend date: Aug-04-2026

Risk Adjusted Returns v/s stock-summary
Returns Beta
Icon
Beta has not been calculated since enough price history is not available
stock-summaryNews & Corporate Actions

News

Announcements stock-summary

ESOP Updates

01-Sep-2026 | Source : BSE

ESOP Updates

Announcement under Regulation 30 (LODR)-Earnings Call Transcript

17-Aug-2026 | Source : BSE

Transcript

Announcement under Regulation 30 (LODR)-Newspaper Publication

12-Aug-2026 | Source : BSE

Newspaper Publication

Corporate Actions stock-summary

stock-summary
BOARD MEETING

No Upcoming Board Meetings

stock-summary
DIVIDEND

TCPL Packaging Ltd. has declared 250% dividend, ex-date: 04 Aug 26

stock-summary
SPLITS

No Splits history available

stock-summary
BONUS

No Bonus history available

stock-summary
RIGHTS

No Rights history available

stock-summaryKey Factors

Quality key factors stock-summary

Factor
Value
Sales Growth (5y)
14.36%
EBIT Growth (5y)
19.96%
EBIT to Interest (avg)
3.30
Debt to EBITDA (avg)
2.36
Net Debt to Equity (avg)
0.85
Sales to Capital Employed (avg)
1.42
Tax Ratio
30.08%
Dividend Payout Ratio
23.26%
Pledged Shares
0
Institutional Holding
14.71%
ROCE (avg)
16.15%
ROE (avg)
19.07%

Valuation key factors

Factor
Value
P/E Ratio
28
Industry P/E
17
Price to Book Value
4.95
EV to EBIT
19.04
EV to EBITDA
13.65
EV to Capital Employed
3.13
EV to Sales
2.22
PEG Ratio
NA
Dividend Yield
0.64%
ROCE (Latest)
15.69%
ROE (Latest)
14.92%

Technicals key factors

Indicator
Weekly
Monthly
MACD
Bullish
Bullish
RSI
No Signal
No Signal
Bollinger Bands
Bullish
Bullish
Moving Averages
Bullish (Daily)
KST
Bullish
Bearish
Dow Theory
Mildly Bearish
No Trend
OBV
No Trend
No Trend
stock-summary Technical Indicator Scale: Bearish, Mildly Bearish, Sideways, Mildly Bullish, Bullish  Turned 
stock-summaryShareholding
Shareholding Snapshot : Jun 2026stock-summary
Shareholding Compare (%holding) stock-summary
Majority shareholders

Promoters

Pledged Promoter Holdings

None

Mutual Funds

Held by 2 Schemes (7.89%)

FIIs

Held by 27 FIIs (1.02%)

Promoter with highest holding

Narmada Fintrade Private Limited (21.4%)

Highest Public shareholder

Anil Kumar Goel (7.69%)

Individual Investors Holdings

23.53%

stock-summaryFinancial
[
  {
    "link": "quarterly",
    "btn_text": "All Quarterly Results",
    "header": "Quarterly Results Snapshot (Consolidated) - Jun'26 - QoQ",
    "rhs": [
      {
        "prefix": "Net Sales ",
        "suffix": "QoQ Growth in quarter ended Jun 2026 is 8.62% vs -3.69% in Mar 2026",
        "dir": 1
      },
      {
        "prefix": "Consolidated Net Profit ",
        "suffix": "QoQ Growth in quarter ended Jun 2026 is 84.21% vs -13.26% in Mar 2026",
        "dir": 1
      }
    ],
    "table": {
      "header": [
        "Jun'26",
        "Mar'26",
        "Change(%)"
      ],
      "body": [
        {
          "field": "Net Sales",
          "val1": "492.97",
          "val2": "453.83",
          "chgp": "8.62%",
          "chgp_class": "positive"
        },
        {
          "field": "Operating Profit (PBDIT) excl Other Income",
          "val1": "85.95",
          "val2": "69.34",
          "chgp": "23.95%",
          "chgp_class": "positive"
        },
        {
          "field": "Interest",
          "val1": "12.28",
          "val2": "17.76",
          "chgp": "-30.86%",
          "chgp_class": "positive"
        },
        {
          "field": "Exceptional Items",
          "val1": "0.00",
          "val2": "-2.22",
          "chgp": "100.00%",
          "chgp_class": "positive"
        },
        {
          "field": "Consolidate Net Profit",
          "val1": "40.01",
          "val2": "21.72",
          "chgp": "84.21%",
          "chgp_class": "positive"
        },
        {
          "field": "Operating Profit Margin (Excl OI)",
          "val1": "17.44%",
          "val2": "15.28%",
          "chgp": "2.16%",
          "chgp_class": "positive"
        }
      ]
    }
  },
  {
    "link": "half-yearly",
    "btn_text": "All Half Yearly Results",
    "header": "Half Yearly Results Snapshot (Consolidated) - Sep'25",
    "rhs": [
      {
        "prefix": "Net Sales ",
        "suffix": " Growth in half year ended Sep 2025 is 1.95% vs 0.00% in Sep 2024",
        "dir": 1
      },
      {
        "prefix": "Consolidated Net Profit ",
        "suffix": " Growth in half year ended Sep 2025 is -24.12% vs 0.00% in Sep 2024",
        "dir": -1
      }
    ],
    "table": {
      "header": [
        "Sep'25",
        "Sep'24",
        "Change(%)"
      ],
      "body": [
        {
          "field": "Net Sales",
          "val1": "885.16",
          "val2": "868.22",
          "chgp": "1.95%",
          "chgp_class": "positive"
        },
        {
          "field": "Operating Profit (PBDIT) excl Other Income",
          "val1": "142.05",
          "val2": "148.32",
          "chgp": "-4.23%",
          "chgp_class": "negative"
        },
        {
          "field": "Interest",
          "val1": "46.10",
          "val2": "26.88",
          "chgp": "71.50%",
          "chgp_class": "negative"
        },
        {
          "field": "Exceptional Items",
          "val1": "0.00",
          "val2": "0.00",
          "chgp": "",
          "chgp_class": "neutral"
        },
        {
          "field": "Consolidate Net Profit",
          "val1": "51.04",
          "val2": "67.26",
          "chgp": "-24.12%",
          "chgp_class": "negative"
        },
        {
          "field": "Operating Profit Margin (Excl OI)",
          "val1": "16.32%",
          "val2": "17.37%",
          "chgp": "-1.05%",
          "chgp_class": "negative"
        }
      ]
    }
  },
  {
    "link": "nine-monthly",
    "btn_text": "All Nine Monthly Results",
    "header": "Nine Monthly Results Snapshot (Consolidated) - Dec'25",
    "rhs": [
      {
        "prefix": "Net Sales ",
        "suffix": "YoY Growth in nine months ended Dec 2025 is 0.63% vs 18.15% in Dec 2024",
        "dir": -1
      },
      {
        "prefix": "Consolidated Net Profit ",
        "suffix": "YoY Growth in nine months ended Dec 2025 is -27.54% vs 47.02% in Dec 2024",
        "dir": -1
      }
    ],
    "table": {
      "header": [
        "Dec'25",
        "Dec'24",
        "Change(%)"
      ],
      "body": [
        {
          "field": "Net Sales",
          "val1": "1,356.38",
          "val2": "1,347.88",
          "chgp": "0.63%",
          "chgp_class": "positive"
        },
        {
          "field": "Operating Profit (PBDIT) excl Other Income",
          "val1": "223.02",
          "val2": "218.92",
          "chgp": "1.87%",
          "chgp_class": "positive"
        },
        {
          "field": "Interest",
          "val1": "61.59",
          "val2": "41.88",
          "chgp": "47.06%",
          "chgp_class": "negative"
        },
        {
          "field": "Exceptional Items",
          "val1": "-11.58",
          "val2": "0.00",
          "chgp": "",
          "chgp_class": "neutral"
        },
        {
          "field": "Consolidate Net Profit",
          "val1": "76.08",
          "val2": "104.99",
          "chgp": "-27.54%",
          "chgp_class": "negative"
        },
        {
          "field": "Operating Profit Margin (Excl OI)",
          "val1": "16.44%",
          "val2": "16.24%",
          "chgp": "0.20%",
          "chgp_class": "positive"
        }
      ]
    }
  },
  {
    "link": "annual",
    "btn_text": "All Annual Results",
    "header": "Annual Results Snapshot (Consolidated) - Mar'26",
    "rhs": [
      {
        "prefix": "Net Sales ",
        "suffix": "YoY Growth in year ended Mar 2026 is 2.26% vs 14.85% in Mar 2025",
        "dir": -1
      },
      {
        "prefix": "Consolidated Net Profit ",
        "suffix": "YoY Growth in year ended Mar 2026 is -31.61% vs 43.89% in Mar 2025",
        "dir": -1
      }
    ],
    "table": {
      "header": [
        "Mar'26",
        "Mar'25",
        "Change(%)"
      ],
      "body": [
        {
          "field": "Net Sales",
          "val1": "1,810.22",
          "val2": "1,770.26",
          "chgp": "2.26%",
          "chgp_class": "positive"
        },
        {
          "field": "Operating Profit (PBDIT) excl Other Income",
          "val1": "292.36",
          "val2": "293.10",
          "chgp": "-0.25%",
          "chgp_class": "negative"
        },
        {
          "field": "Interest",
          "val1": "79.35",
          "val2": "58.26",
          "chgp": "36.20%",
          "chgp_class": "negative"
        },
        {
          "field": "Exceptional Items",
          "val1": "-13.79",
          "val2": "0.00",
          "chgp": "",
          "chgp_class": "neutral"
        },
        {
          "field": "Consolidate Net Profit",
          "val1": "97.80",
          "val2": "143.01",
          "chgp": "-31.61%",
          "chgp_class": "negative"
        },
        {
          "field": "Operating Profit Margin (Excl OI)",
          "val1": "16.15%",
          "val2": "16.56%",
          "chgp": "-0.41%",
          "chgp_class": "negative"
        }
      ]
    }
  }
]

Quarterly Results Snapshot (Consolidated) - Jun'26 - QoQstock-summary

Jun'26
Mar'26
Change(%)
Net Sales
492.97
453.83
8.62%
Operating Profit (PBDIT) excl Other Income
85.95
69.34
23.95%
Interest
12.28
17.76
-30.86%
Exceptional Items
0.00
-2.22
100.00%
Consolidate Net Profit
40.01
21.72
84.21%
Operating Profit Margin (Excl OI)
17.44%
15.28%
2.16%
Values in Rs Cr.
Direction Arrows
Net Sales

QoQ Growth in quarter ended Jun 2026 is 8.62% vs -3.69% in Mar 2026

Direction Arrows
Consolidated Net Profit

QoQ Growth in quarter ended Jun 2026 is 84.21% vs -13.26% in Mar 2026

Half Yearly Results Snapshot (Consolidated) - Sep'25stock-summary

Sep'25
Sep'24
Change(%)
Net Sales
885.16
868.22
1.95%
Operating Profit (PBDIT) excl Other Income
142.05
148.32
-4.23%
Interest
46.10
26.88
71.50%
Exceptional Items
0.00
0.00
Consolidate Net Profit
51.04
67.26
-24.12%
Operating Profit Margin (Excl OI)
16.32%
17.37%
-1.05%
Values in Rs Cr.
Direction Arrows
Net Sales

Growth in half year ended Sep 2025 is 1.95% vs 0.00% in Sep 2024

Direction Arrows
Consolidated Net Profit

Growth in half year ended Sep 2025 is -24.12% vs 0.00% in Sep 2024

Nine Monthly Results Snapshot (Consolidated) - Dec'25stock-summary

Dec'25
Dec'24
Change(%)
Net Sales
1,356.38
1,347.88
0.63%
Operating Profit (PBDIT) excl Other Income
223.02
218.92
1.87%
Interest
61.59
41.88
47.06%
Exceptional Items
-11.58
0.00
Consolidate Net Profit
76.08
104.99
-27.54%
Operating Profit Margin (Excl OI)
16.44%
16.24%
0.20%
Values in Rs Cr.
Direction Arrows
Net Sales

YoY Growth in nine months ended Dec 2025 is 0.63% vs 18.15% in Dec 2024

Direction Arrows
Consolidated Net Profit

YoY Growth in nine months ended Dec 2025 is -27.54% vs 47.02% in Dec 2024

Annual Results Snapshot (Consolidated) - Mar'26stock-summary

Mar'26
Mar'25
Change(%)
Net Sales
1,810.22
1,770.26
2.26%
Operating Profit (PBDIT) excl Other Income
292.36
293.10
-0.25%
Interest
79.35
58.26
36.20%
Exceptional Items
-13.79
0.00
Consolidate Net Profit
97.80
143.01
-31.61%
Operating Profit Margin (Excl OI)
16.15%
16.56%
-0.41%
Values in Rs Cr.
Direction Arrows
Net Sales

YoY Growth in year ended Mar 2026 is 2.26% vs 14.85% in Mar 2025

Direction Arrows
Consolidated Net Profit

YoY Growth in year ended Mar 2026 is -31.61% vs 43.89% in Mar 2025

stock-summaryCompany CV
About TCPL Packaging Ltd. stock-summary
stock-summary
TCPL Packaging Ltd.
Small Cap
Packaging
TCPL Packaging Limited, formerly known as Twenty-First Century Printers Limited was incorporated in August 1987. The name of Company was changed from Twenty-First Century Printers Limited to TCPL Packaging Limited in September, 2008. Company was promoted by Sajjan Jindal, Debasis Chaudhri and members of the Kanoria family. The Company is one of India's largest folding carton manufacturers and convertors of paperboard.
Company Coordinates stock-summary
Company Details
Empire Mills Complex, 414 S B Marg Lower Parel (W) Mumbai Maharashtra : 400013
stock-summary
Tel: 91-22-61646000
stock-summary
info@tcpl.in
Registrar Details
Link Intime India Pvt Ltd, C-13 Pannalal Silk Compound, L B S Marg, Bhandup , Mumbai