
Compare Team India Guar. with Similar Stocks
Dashboard
With a Operating Losses, the company has a Weak Long Term Fundamental Strength
- Poor long term growth as Net Sales has grown by an annual rate of -9.44% and Operating profit at -29.73%
Negative results in Mar 26
With ROE of 1.5, it has a Very Expensive valuation with a 4.5 Price to Book Value
Stock DNA
Non Banking Financial Company (NBFC)
INR 225 Cr (Micro Cap)
306.00
20
0.00%
0.00
1.46%
4.57
Total Returns (Price + Dividend) 
Team India Guar. for the last several years.
Risk Adjusted Returns v/s
Returns Beta

News

Team India Guaranty Ltd is Rated Strong Sell
Team India Guaranty Ltd is rated Strong Sell by MarketsMOJO, with this rating last updated on 04 May 2026. However, the analysis and financial metrics discussed here reflect the company’s current position as of 11 June 2026, providing investors with an up-to-date view of its fundamentals, valuation, financial trend, and technical outlook.
Read full news article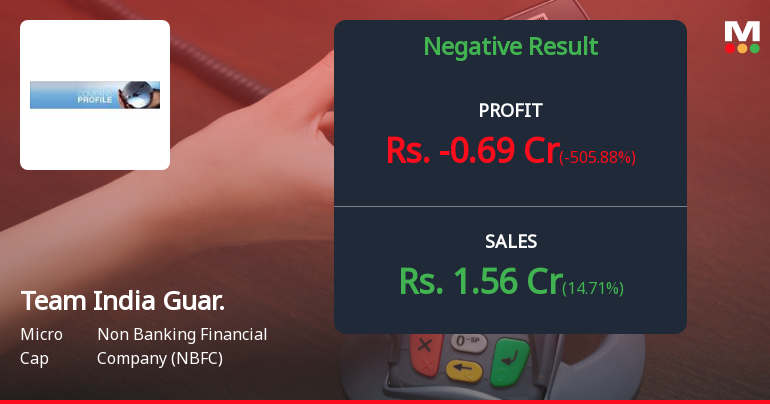
Team India Guaranty Q4 FY26: Sharp Loss Raises Serious Questions About Business Sustainability
Team India Guaranty Ltd., a micro-cap non-banking financial company with a market capitalisation of ₹243.00 crores, reported a jarring quarterly loss of ₹0.69 crores for Q4 FY26, marking a dramatic reversal from the ₹0.72 crores profit recorded in Q4 FY25. The unexpected loss, accompanied by a catastrophic 196% quarter-on-quarter decline and a 195.83% year-on-year contraction, has sent alarm bells ringing among investors about the company's operational viability and management effectiveness.
Read full news article
Team India Guaranty Ltd is Rated Strong Sell
Team India Guaranty Ltd is rated Strong Sell by MarketsMOJO, with this rating last updated on 04 May 2026. However, the analysis and financial metrics presented here reflect the stock’s current position as of 27 May 2026, providing investors with the latest insights into the company’s fundamentals, valuation, financial trends, and technical outlook.
Read full news article Announcements
Announcement under Regulation 30 (LODR)-Updates on Acquisition
09-Jun-2026 | Source : BSEPlease find enclosed the intimation as per Regulation 30 of SEBI (LODR) Regulations 2015.
Intimation Under Regulation 30 Of The SEBI (Listing Obligations And Disclosure Requirements) Regulations 2015 (SEBI LODR)
09-Jun-2026 | Source : BSEPlease find enclosed intimation Pursuant to Regulation 30 of SEBI (LODR) Regulations 2015.
Announcement under Regulation 30 (LODR)-Newspaper Publication
30-May-2026 | Source : BSEPursuant to Regulation 30 of SEBI (LODR) Regulations 2015 please find enclosed herewith the newspaper advertisement for the Extracts of the Standalone Audited Financial Results of Team India Guaranty Limited for the quarter and the year ended 31st March 2026 published in all editions of Financials Express (English) and Mumbai Lakshadweep (Mumbai) on 30th May 2026
Corporate Actions

No Upcoming Board Meetings

No Dividend history available

No Splits history available

No Bonus history available

No Rights history available
Quality key factors
Valuation key factors
Technicals key factors
 Technical Indicator Scale: Bearish, Mildly Bearish, Sideways, Mildly Bullish, Bullish Turned
 Shareholding Snapshot : Mar 2026
Shareholding Compare (%holding)
Promoters
None
Held by 3 Schemes (0.01%)
Held by 2 FIIs (2.08%)
Team India Managers Ltd (45.31%)
Lords Multigrowth Fund (1.74%)
19.64%
Quarterly Results Snapshot (Standalone) - Mar'26 - QoQ

QoQ Growth in quarter ended Mar 2026 is 14.71% vs -0.73% in Dec 2025

QoQ Growth in quarter ended Mar 2026 is -505.88% vs -74.63% in Dec 2025
Half Yearly Results Snapshot (Standalone) - Sep'25
Growth in half year ended Sep 2025 is 54.71% vs 6.25% in Sep 2024
Growth in half year ended Sep 2025 is 17.14% vs 14.13% in Sep 2024
Nine Monthly Results Snapshot (Standalone) - Dec'25
YoY Growth in nine months ended Dec 2025 is 56.47% vs 5.81% in Dec 2024
YoY Growth in nine months ended Dec 2025 is -14.11% vs 15.60% in Dec 2024
Annual Results Snapshot (Standalone) - Mar'26
YoY Growth in year ended Mar 2026 is 55.52% vs 8.95% in Mar 2025
YoY Growth in year ended Mar 2026 is -68.00% vs 25.70% in Mar 2025
About Team India Guaranty Ltd

Company Coordinates


