
Compare Team India Guar. with Similar Stocks
Dashboard
With a Operating Losses, the company has a Weak Long Term Fundamental Strength
- Poor long term growth as Net Sales has grown by an annual rate of -9.44% and Operating profit at -29.73%
Negative results in Mar 26
With ROE of 1.5, it has a Very Expensive valuation with a 4.3 Price to Book Value
Stock DNA
Non Banking Financial Company (NBFC)
INR 219 Cr (Micro Cap)
295.00
21
0.00%
0.00
1.46%
4.05
Total Returns (Price + Dividend) 
Team India Guar. for the last several years.
Risk Adjusted Returns v/s
Returns Beta

News
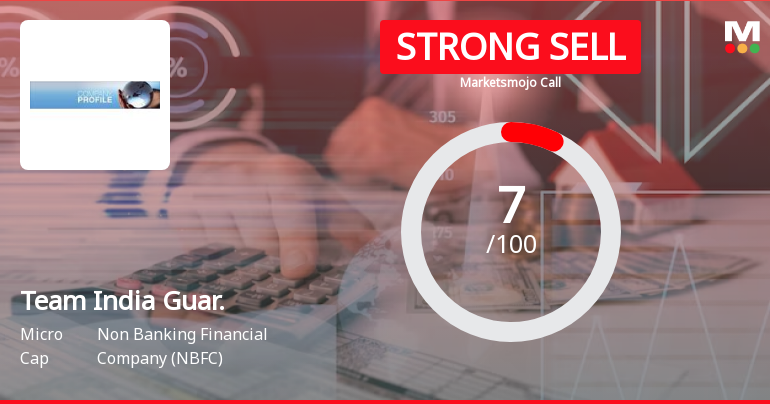
Team India Guaranty Ltd is Rated Strong Sell
Team India Guaranty Ltd is rated Strong Sell by MarketsMOJO, with this rating last updated on 04 May 2026. However, the analysis and financial metrics presented here reflect the stock’s current position as of 15 July 2026, providing investors with the most recent and relevant data to assess the company’s outlook.
Read full news article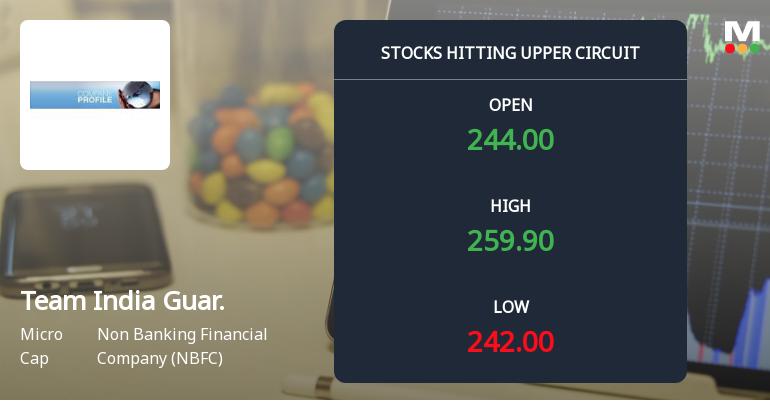
Team India Guaranty Ltd Locks at Upper Circuit With 20% Gain — Buyers Queue, Sellers Absent
At Rs 262.11, the buying was done — not because demand dried up, but because the exchange wouldn't let the stock go any higher. Team India Guaranty Ltd locked at its upper circuit of 20% on 09 Jul 2026, with buyers queuing and no sellers willing to part with shares.
Read full news article
Team India Guaranty Ltd is Rated Strong Sell
Team India Guaranty Ltd is rated Strong Sell by MarketsMOJO, with this rating last updated on 04 May 2026. However, the analysis and financial metrics discussed here reflect the stock's current position as of 04 July 2026, providing investors with the latest insights into the company’s performance and outlook.
Read full news article Announcements
Announcement under Regulation 30 (LODR)-Newspaper Publication
17-Jul-2026 | Source : BSEIn continuation of our earlier intimation dated 16th July 2026 regarding the issue of Postal Ballot Notice and remote e-voting please find enclosed the newspaper advertisement published in all editions of Financial Express (English) and Mumbai Lakshadweep (Marathi) on 17th July 2026.
Shareholder Meeting / Postal Ballot-Notice of Postal Ballot
16-Jul-2026 | Source : BSEPOSTAL BALLOT NOTICE
Compliances-Certificate under Reg. 74 (5) of SEBI (DP) Regulations 2018
13-Jul-2026 | Source : BSEIn compliance with Regulation 74(5) of SEBI (Depositories and Participants) Regulations 2018 please find enclosed herewith a Certificate received from M/s MUFG Intime India Private Limited the Registrar and Share Transfer Agent of the Company for the quarter ended 30th June 2026. Kindly take the above intimation on your records.
Corporate Actions

No Upcoming Board Meetings

No Dividend history available

No Splits history available

No Bonus history available

No Rights history available
Quality key factors
Valuation key factors
Technicals key factors
 Technical Indicator Scale: Bearish, Mildly Bearish, Sideways, Mildly Bullish, Bullish Turned
 Shareholding Snapshot : Jun 2026
Shareholding Compare (%holding)
Promoters
None
Held by 3 Schemes (0.01%)
Held by 2 FIIs (2.08%)
Team India Managers Ltd (45.31%)
Lords Multigrowth Fund (1.74%)
19.71%
Quarterly Results Snapshot (Standalone) - Mar'26 - QoQ

QoQ Growth in quarter ended Mar 2026 is 14.71% vs -0.73% in Dec 2025

QoQ Growth in quarter ended Mar 2026 is -505.88% vs -74.63% in Dec 2025
Half Yearly Results Snapshot (Standalone) - Sep'25
Growth in half year ended Sep 2025 is 54.71% vs 6.25% in Sep 2024
Growth in half year ended Sep 2025 is 17.14% vs 14.13% in Sep 2024
Nine Monthly Results Snapshot (Standalone) - Dec'25
YoY Growth in nine months ended Dec 2025 is 56.47% vs 5.81% in Dec 2024
YoY Growth in nine months ended Dec 2025 is -14.11% vs 15.60% in Dec 2024
Annual Results Snapshot (Standalone) - Mar'26
YoY Growth in year ended Mar 2026 is 55.52% vs 8.95% in Mar 2025
YoY Growth in year ended Mar 2026 is -68.00% vs 25.70% in Mar 2025
About Team India Guaranty Ltd

Company Coordinates


