
Compare Technvision Ven. with Similar Stocks
Dashboard
Poor long term growth as Operating profit has grown by an annual rate -11.24% of over the last 5 years
- PAT(Q) At Rs -4.24 cr has Fallen at -410.8%
- ROCE(HY) Lowest at 12.15%
- PBDIT(Q) Lowest at Rs -2.72 cr.
With ROE of 1.4, it has a Very Expensive valuation with a 186.7 Price to Book Value
Despite the size of the company, domestic mutual funds hold only 0% of the company
Stock DNA
Software Products
INR 2,932 Cr (Small Cap)
13,342.00
27
0.00%
-0.73
1.40%
198.58
Total Returns (Price + Dividend) 
Technvision Ven. for the last several years.
Risk Adjusted Returns v/s
Returns Beta

News

TechNVision Ventures Ltd is Rated Strong Sell
TechNVision Ventures Ltd is rated Strong Sell by MarketsMOJO. This rating was last updated on 29 May 2026, reflecting a significant reassessment of the stock’s outlook. However, all fundamentals, returns, and financial metrics discussed below are current as of 01 August 2026, providing investors with the latest perspective on the company’s position.
Read full news article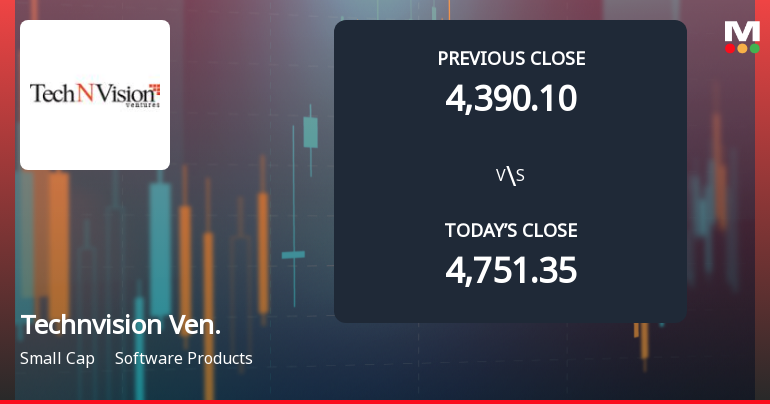

TechNVision Ventures Ltd Hits Intraday Low Amid Price Pressure
TechNVision Ventures Ltd experienced a significant intraday decline on 31 Jul 2026, touching a low of Rs 4,390.05, marking a 7.6% drop from its previous close. The stock underperformed its sector and broader market indices, reflecting immediate selling pressure and subdued market sentiment.
Read full news article Announcements
Reply To The Query Raised In Respect Of Price Movement Vide Email Dated July 24 2026.
24-Jul-2026 | Source : BSEWith reference to the exchange email dated 24.07.2026 we are enclosing the clarification letter and reply to the query raised by the exchange on sudden price movement in the Companys Scrip.
Clarification sought from TechNVision Ventures Ltd
24-Jul-2026 | Source : BSEThe Exchange has sought clarification from TechNVision Ventures Ltd on July 24 2026 with reference to significant movement in price in order to ensure that investors have latest relevant information about the company and to inform the market so that the interest of the investors is safeguarded.
The reply is awaited.
Compliances-Certificate under Reg. 74 (5) of SEBI (DP) Regulations 2018
15-Jul-2026 | Source : BSEPlease find the attached Compliance Certificate received pursuant to Regulation 74 of the SEBI(DP) Regulations 2018 for 30th June 2026.
Corporate Actions

No Upcoming Board Meetings

No Dividend history available

No Splits history available

No Bonus history available

No Rights history available
Quality key factors
Valuation key factors
Technicals key factors
 Technical Indicator Scale: Bearish, Mildly Bearish, Sideways, Mildly Bullish, Bullish Turned
 Shareholding Snapshot : Jun 2026
Shareholding Compare (%holding)
Promoters
None
Held by 0 Schemes
Held by 0 FIIs
Tiebeam Technologies India Private Limited (53.67%)
Solix Esop Foundation (4.72%)
7.41%
Quarterly Results Snapshot (Consolidated) - Mar'26 - YoY

YoY Growth in quarter ended Mar 2026 is 70.55% vs -23.84% in Mar 2025

YoY Growth in quarter ended Mar 2026 is -410.84% vs -109.36% in Mar 2025
Half Yearly Results Snapshot (Consolidated) - Sep'25
Growth in half year ended Sep 2025 is 18.93% vs 32.23% in Sep 2024
Growth in half year ended Sep 2025 is 276.19% vs 90.19% in Sep 2024
Nine Monthly Results Snapshot (Consolidated) - Dec'25
YoY Growth in nine months ended Dec 2025 is 7.31% vs 33.56% in Dec 2024
YoY Growth in nine months ended Dec 2025 is 373.40% vs -79.83% in Dec 2024
Annual Results Snapshot (Consolidated) - Mar'26
YoY Growth in year ended Mar 2026 is 18.23% vs 18.18% in Mar 2025
YoY Growth in year ended Mar 2026 is 100.00% vs -99.19% in Mar 2025
About TechNVision Ventures Ltd

Company Coordinates


