
Compare Techprecision Corp. with Similar Stocks
Dashboard
Poor Management Efficiency with a low ROCE of 1.61%
- The company has been able to generate a Return on Capital Employed (avg) of 1.61% signifying low profitability per unit of total capital (equity and debt)
The company has declared positive results in Dec'2024 after 6 consecutive negative quarters
Risky - Negative EBITDA
Stock DNA
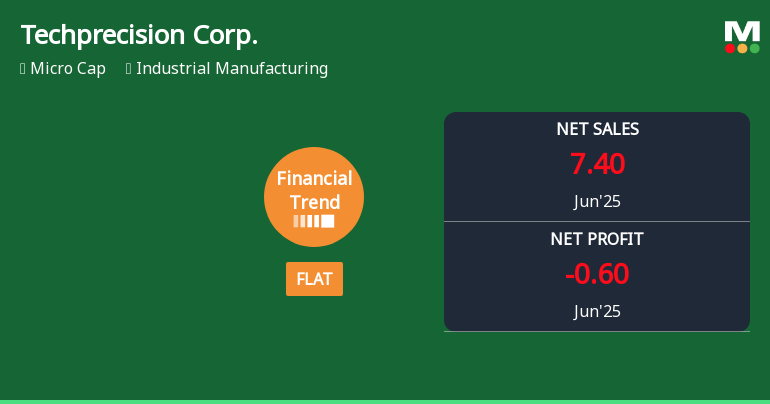
Industrial Manufacturing
USD 48 Million (Micro Cap)
NA (Loss Making)
NA
0.00%
0.85
-5.04%
5.23
Total Returns (Price + Dividend) 
Techprecision Corp. for the last several years.
Risk Adjusted Returns v/s
News
Techprecision Corp. Experiences Revision in Its Stock Evaluation Amid Financial Adjustments
Techprecision Corp. has reported a net profit of USD -0.48 million for the half-year, facing challenges with operating cash flow and low inventory turnover. Despite a significant reduction in raw material costs, the company’s net sales declined, and its stock performance has varied compared to the S&P 500.
Read full news article Announcements

Corporate Actions
Quality key factors
Valuation key factors
Technicals key factors
 Technical Indicator Scale: Bearish, Mildly Bearish, Sideways, Mildly Bullish, Bullish Turned
 Shareholding Snapshot : Sep 2025
Shareholding Compare (%holding)
Domestic Funds
Held in 5 Schemes (4.72%)
Held by 5 Foreign Institutions (0.33%)
Quarterly Results Snapshot (Consolidated) - Jun'25 - QoQ

QoQ Growth in quarter ended Jun 2025 is -22.11% vs 25.00% in Mar 2025
QoQ Growth in quarter ended Jun 2025 is -700.00% vs 112.50% in Mar 2025
Annual Results Snapshot (Consolidated) - Mar'25

YoY Growth in year ended Mar 2025 is 7.59% vs 0.64% in Mar 2024
YoY Growth in year ended Mar 2025 is 61.43% vs -600.00% in Mar 2024
About Techprecision Corp.

Company Coordinates


