Tega Inds.

  • Market Cap: Small Cap
  • Industry: Industrial Manufacturing
  • ISIN: INE011K01018
  • NSEID: TEGA
  • BSEID: 543413
INR
1,764.00
164.3 (10.27%)
BSENSE

May 29

BSE+NSE Vol: 26.58 lacs

  • Price Points
  • Score
  • Mojo Parameters
  • Total Return
  • News and Corporate Actions
  • Key factors
  • Shareholding
  • Financials
  • CompanyCV
stock-summaryPrice Point
High/Low

1Day

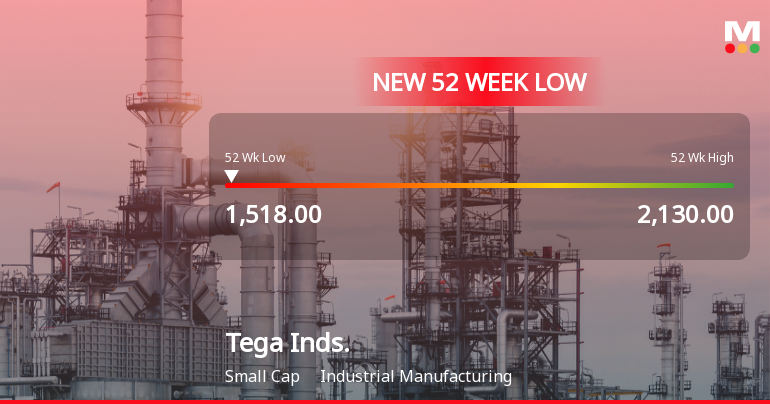
52 Week

Valuation
Technical
Day's Volume

CASH

26.58 lacs (377.42%) Volume

Shareholding (Mar 2026)

FII

2.14%

Held by 77 FIIs

DII

18.96%

Held by 20 DIIs

Promoter

67.50%

Is Tega Inds. overvalued or undervalued?

09-Jun-2025

As of May 15, 2023, Tega Industries is considered very expensive and overvalued with a PE ratio of 53.03, significantly higher than its peers, indicating that its current stock price is not justified despite a recent strong return.

As of 15 May 2023, Tega Industries has moved from expensive to very expensive in its valuation grade. The company is currently overvalued, with a PE ratio of 53.03, a Price to Book Value of 7.60, and an EV to EBITDA ratio of 31.14. These figures suggest that the stock is trading at a premium compared to its earnings and book value.<BR><BR>In comparison to its peers, Tega Industries stands out with a significantly higher PE ratio than Larsen & Toubro Ltd., which has a PE of 34.21, indicating that Tega is priced much higher relative to its earnings. Siemens Ltd. also shows a higher valuation with a PE of 56.88, but Tega's valuation remains on the higher end of the spectrum. Despite a strong return of 26.16% over the past month compared to the Sensex's 3.81%, the overall valuation metrics indicate that Tega Industries is not justified at its current price level.

View full answer

Who are the top shareholders of the Tega Inds.?

06-Jun-2025

The top shareholders of Tega Industries include Nihal Fiscal Services Private Limited with 55.8%, mutual funds holding 15.69%, and HDFC Trustee Company Ltd. with 3.68%. Individual investors own approximately 3.6%, and there are no pledged promoter holdings.

The top shareholders of Tega Industries include the promoters, who hold the majority of the shares. The promoter with the highest holding is Nihal Fiscal Services Private Limited, which owns 55.8% of the company. Additionally, mutual funds collectively hold 15.69% through 18 different schemes. Among public shareholders, HDFC Trustee Company Ltd., acting on behalf of the HDFC Balanced Advantage Fund, is the largest, with a holding of 3.68%. Individual investors also hold about 3.6% of the shares. There are no pledged promoter holdings reported.

View full answer

What does Tega Inds. do?

06-Jun-2025

Tega Industries Ltd is a mid-cap company in the industrial manufacturing sector, reporting net sales of 536 Cr and a net profit of 102 Cr for the quarter ending March 2025. Key metrics include a P/E ratio of 54.00 and a market cap of Rs 10,662 Cr.

Overview: <BR>Tega Industries Ltd operates in the industrial manufacturing sector and is classified as a mid-cap company.<BR><BR>History: <BR>Tega Industries Ltd was originally incorporated as Tega India Limited in 1976. The company underwent a name change to Tega Industries Limited on February 1, 2002. The most recent quarterly results reported net sales and net profit for the period ending March 2025.<BR><BR>Financial Snapshot: <BR>Most recent Net Sales: 536 Cr (Quarterly Results - Mar 2025) <BR>Most recent Net Profit: 102 Cr (Quarterly Results - Mar 2025) <BR>Market-cap value: Rs 10,662 Cr (Mid Cap)<BR><BR>Key Metrics: <BR>P/E: 54.00 <BR>Industry P/E: 40 <BR>Dividend Yield: 0.12% <BR>Debt Equity: -0.02 <BR>Return on Equity: 14.33% <BR>Price to Book: 7.73 <BR><BR>Contact Details: <BR>Address: Not available <BR>Phone: N/A <BR>Email: N/A <BR>Website: N/A

View full answer

Who are in the management team of Tega Inds.?

06-Jun-2025

As of March 2022, Tega Industries' management team includes Chairman Madan Mohan Mohanka, Group CEO Mehul Mohanka, Executive Director Syed Yaver Imam, and several independent and non-executive directors, with varying remuneration levels. Manjuree Rai serves as the Company Secretary & Compliance Officer.

As of March 2022, the management team of Tega Industries includes:<BR><BR>- **Madan Mohan Mohanka**: Chairman & Executive Director, with a remuneration of Rs. 6.04 crore.<BR>- **Mehul Mohanka**: Group CEO & Executive Director, with a remuneration of Rs. 6.95 crore.<BR>- **Syed Yaver Imam**: Executive Director, with a remuneration of Rs. 2.04 crore.<BR>- **Jagdishwar Prasad Sinha**: Independent Director, with a remuneration of Rs. 12.6 lakhs.<BR>- **Madhu Damani**: Independent Director, with a remuneration of Rs. 12.6 lakhs.<BR>- **Ashwani Maheshwari**: Non-Executive Director, with a remuneration of Rs. 12.8 lakhs.<BR>- **Manjuree Rai**: Company Secretary & Compliance Officer, with no remuneration listed.<BR><BR>This outlines the key members of the management team and their respective roles within the company.

View full answer

Has Tega Inds. declared dividend?

06-Jun-2025

Tega Industries Ltd has declared a 20% dividend, amounting to ₹2 per share, with an ex-date of August 9, 2024. The dividend yield is 0.12%, and total returns have shown strong performance over longer periods, particularly a 250.43% total return over three years.

Tega Industries Ltd has declared a 20% dividend.<BR><BR>Dividend Details:<BR>- Percentage announced: 20%<BR>- Amount per share: 2<BR>- Ex-date: 09 Aug 24<BR><BR>Dividend Yield: 0.12%.<BR><BR>Total Returns by Period:<BR>In the last 6 months, the price return was 0.13%, with a dividend return of 0%, resulting in a total return of 0.13%.<BR><BR>Over the past year, the price return was 4.21%, with a dividend return of 0.12%, leading to a total return of 4.33%.<BR><BR>In the two-year period, the price return was 79.56%, with a dividend return of 0.43%, culminating in a total return of 79.99%.<BR><BR>For the three-year period, the price return was 249.56%, with a dividend return of 0.87%, resulting in a total return of 250.43%.<BR><BR>In the four-year period, there was no price return or dividend return, resulting in a total return of 0.0%.<BR><BR>Over the five-year period, there was also no price return or dividend return, leading to a total return of 0.0%.<BR><BR>Overall, Tega Industries Ltd has declared a dividend, contributing to a modest dividend yield. The total returns indicate strong performance over longer periods, particularly in the three-year timeframe, despite some periods showing no returns.

View full answer

Who are the peers of the Tega Inds.?

16-Jul-2025

Tega Inds. peers include LMW, Jupiter Wagons, Elecon Engg.Co, Titagarh Rail, Syrma SGS Tech., Praj Industries, Lloyds Engineeri, Texmaco Rail, GMM Pfaudler, and The Anup Enginee. Management risk varies from excellent to average, with Tega Inds. showing good growth and a 1-year return of 5.04%.

Peers: The peers of Tega Inds. are LMW, Jupiter Wagons, Elecon Engg.Co, Titagarh Rail, Syrma SGS Tech., Praj Industries, Lloyds Engineeri, Texmaco Rail, GMM Pfaudler, and The Anup Enginee.<BR><BR>Quality Snapshot: Excellent management risk is observed at Elecon Engg.Co, Praj Industries, GMM Pfaudler, and The Anup Enginee, while Good management risk is found at Tega Inds., Syrma SGS Tech., and the rest. Average management risk is present at LMW, Jupiter Wagons, Titagarh Rail, Lloyds Engineeri, and Texmaco Rail. Growth is Excellent at Jupiter Wagons, Praj Industries, and Lloyds Engineeri, while Good growth is seen at Elecon Engg.Co, Titagarh Rail, Syrma SGS Tech., and Tega Inds., and the rest show Below Average or Average growth. Capital Structure is Excellent for LMW, Jupiter Wagons, Elecon Engg.Co, Praj Industries, Lloyds Engineeri, and Tega Inds., while Good is found at Syrma SGS Tech. and GMM Pfaudler, and Below Average at Titagarh Rail and Texmaco Rail.<BR><BR>Return Snapshot: Syrma SGS Tech. has the highest 1-year return at 45.44%, while Jupiter Wagons has the lowest at -43.73%. Tega Inds. has a 1-year return of 5.04%, which is significantly higher than Jupiter Wagons but lower than Syrma SGS Tech. Additionally, peers such as Jupiter Wagons, Titagarh Rail, and Texmaco Rail have negative six-month returns.

View full answer

How big is Tega Inds.?

24-Jul-2025

As of 24th July, Tega Industries Ltd has a market capitalization of 12,974.00 Cr, with net sales of 1,638.66 Cr and a net profit of 200.12 Cr reported in the latest four quarters.

As of 24th July, Tega Industries Ltd has a market capitalization of 12,974.00 Cr, categorizing it as a Mid Cap company.<BR><BR>In the latest four quarters, Tega Industries reported net sales of 1,638.66 Cr and a net profit of 200.12 Cr.<BR><BR>The latest annual period for the balance sheet is March 2024, with shareholder's funds amounting to 1,191.82 Cr and total assets of 1,871.21 Cr.

View full answer

Is Tega Inds. technically bullish or bearish?

27-Nov-2025

As of 26 November 2025, Tega Inds. shows a mildly bullish trend supported by daily moving averages, though caution is advised due to mixed signals from weekly and monthly indicators.

As of 26 November 2025, the technical trend for Tega Inds. has changed from sideways to mildly bullish. The current stance is mildly bullish, driven primarily by the daily moving averages indicating bullish momentum. However, the weekly and monthly MACD and Dow Theory readings are mildly bearish, suggesting some caution. The Bollinger Bands on a monthly basis are mildly bullish, providing additional support to the overall bullish sentiment. The KST shows a mixed signal with a bullish monthly reading but a mildly bearish weekly one. Overall, the strength of the bullish trend is tempered by the bearish signals in the longer time frames.

View full answer

How has been the historical performance of Tega Inds.?

01-Dec-2025

Tega Inds. has shown consistent growth over the past five years, with net sales increasing from 805.52 Cr in Mar'21 to 1,638.65 Cr in Mar'25, and profit after tax rising from 133.73 Cr to 195.65 Cr. The company's total assets also grew significantly, reflecting robust financial stability.

Answer:<BR>The historical performance of Tega Inds. shows a consistent growth trend across various financial metrics over the past five years.<BR><BR>Breakdown:<BR>Tega Inds. has demonstrated significant growth in net sales, increasing from 805.52 Cr in Mar'21 to 1,638.65 Cr in Mar'25. This upward trend is reflected in total operating income, which rose from 805.52 Cr to 1,638.65 Cr during the same period. The company’s total expenditure also increased, from 618.04 Cr in Mar'21 to 1,298.84 Cr in Mar'25, leading to an operating profit (PBDIT) growth from 187.48 Cr to 382.96 Cr. Profit before tax has similarly improved, reaching 254.73 Cr in Mar'25 compared to 181.18 Cr in Mar'21. Consequently, profit after tax has risen from 133.73 Cr to 195.65 Cr over the same timeframe. The earnings per share (EPS) have increased from 23.68 to 30.08, indicating enhanced shareholder value. On the balance sheet, total assets grew from 856.53 Cr in Mar'21 to 2,058.32 Cr in Mar'25, while total liabilities also increased from 992.71 Cr to 2,058.32 Cr. The cash flow from operating activities peaked at 195.00 Cr in Mar'25, although cash flow from investing activities showed a negative trend, indicating ongoing investments. Overall, Tega Inds. has shown robust financial growth and stability over the past five years.

View full answer

When is the next results date for Tega Industries Ltd?

05-Feb-2026

The next results date for Tega Industries Ltd is 12 February 2026.

The next results date for Tega Industries Ltd is scheduled for 12 February 2026.

View full answer

Why is Tega Industries Ltd falling/rising?

30-May-2026

As of 29-May, Tega Industries Ltd's stock price has risen to 1,764.00, reflecting a 10.27% increase due to strong investor interest and performance, outperforming the sector. Key factors include high management efficiency, increased delivery volume, and a notable rise in institutional holdings, despite some long-term growth concerns.

As of 29-May, Tega Industries Ltd is experiencing a rise in its stock price, currently at 1,764.00, which reflects an increase of 164.3 or 10.27%. This upward movement can be attributed to several factors. Firstly, the stock has outperformed the sector by 6.85% today and has shown a consecutive gain over the last two days, accumulating a total return of 7.73% during this period. Additionally, the stock reached an intraday high of Rs 1829.2, indicating strong buying interest.<BR><BR>Moreover, there has been a notable increase in investor participation, with delivery volume rising by 51.55% compared to the 5-day average. This suggests that more investors are willing to hold onto the stock, which can contribute to upward price pressure. The stock's performance over the past week shows a gain of 9.95%, contrasting with a decline in the benchmark Sensex by 0.85%, further highlighting its relative strength.<BR><BR>Tega Industries Ltd also boasts high management efficiency, reflected in a return on capital employed (ROCE) of 20.56%, and a low debt-to-equity ratio of 0.01 times, which indicates financial stability. Additionally, institutional holdings have increased by 1.02% over the previous quarter, suggesting confidence from larger investors who typically have more resources to analyze company fundamentals.<BR><BR>Despite some concerns regarding long-term growth and profitability metrics, the recent performance and positive investor sentiment have contributed to the stock's rise. Overall, the combination of strong short-term gains, increased investor participation, and solid management efficiency are key factors driving the stock price upward.

View full answer

Should I buy, sell or hold Tega Industries Ltd?

30-May-2026

Are Tega Industries Ltd latest results good or bad?

30-May-2026

Tega Industries Ltd's latest results show strong revenue growth of 30.48%, but profitability has declined significantly, with net profit margins dropping to 8.10% and a 58.13% year-on-year profit decrease. While revenue growth is positive, concerns about margin compression and reliance on other income suggest underlying challenges for the company.

Tega Industries Ltd's latest results present a mixed picture. On one hand, the company achieved robust revenue growth of 30.48% quarter-on-quarter, reaching ₹526.78 crores in Q4 FY26. This indicates strong demand and operational momentum. However, the profitability metrics reveal significant challenges. <BR><BR>Operating margins, excluding other income, slightly compressed to 11.42% from 11.44% in the previous quarter, and net profit margins fell sharply to 8.10%, down from 19.01% in the same quarter last year. This decline in profitability is concerning, especially given that net profit dropped 58.13% year-on-year, despite only a modest revenue decline of 1.74%.<BR><BR>Additionally, the company's heavy reliance on other income, which constituted 54.25% of profit before tax, raises questions about the sustainability of its earnings. The significant contraction in core operational profitability suggests that Tega Industries is facing substantial headwinds.<BR><BR>Overall, while the revenue growth is a positive sign, the deterioration in margins and profit quality points to underlying issues that investors should be cautious about. The current valuation, trading at a high price-to-earnings ratio compared to industry averages, further complicates the outlook, indicating that the stock may be overvalued given its recent performance.

View full answer
iScoreScore
Click here to find our call on this stock
Strong Sell
Sell
Hold
Buy
Strong Buy

Dashboard

1

Poor long term growth as Operating profit has grown by an annual rate 14.82% of over the last 5 years

  • PBT LESS OI(Q) At Rs 30.80 cr has Fallen at -40.2% (vs previous 4Q average)
  • PAT(Q) At Rs 42.67 cr has Fallen at -15.5% (vs previous 4Q average)
  • NON-OPERATING INCOME(Q) is 54.25 % of Profit Before Tax (PBT)
2

With ROE of 16, it has a Very Expensive valuation with a 8.7 Price to Book Value

stock-summaryMojo Parameters

Mojo Parameters

Loading Valuation Snapshot...

Stock DNA

stock-summary
Industry

Industrial Manufacturing

stock-summary
Market cap

INR 11,863 Cr (Small Cap)

stock-summary
P/E

64.00

stock-summary
Industry P/E

45

stock-summary
Dividend Yield

0.11%

stock-summary
Debt Equity

-0.07

stock-summary
Return on Equity

16.02%

stock-summary
Price to Book

8.15

Revenue and Profits:
Net Sales:
527 Cr
(Quarterly Results - Mar 2026)
Net Profit:
43 Cr
stock-summaryTotal Returns
Total Returns (Price + Dividend) stock-summary
Dividend Yield (0.11%)
TimePeriod
Price Return
Dividend Return
Total Return
3 Months
-3.08%
0%
-3.08%
6 Months
-8.83%
0%
-8.83%
1 Year
7.46%
0.12%
7.58%
2 Years
17.87%
0.24%
18.11%
3 Years
115.66%
0.65%
116.31%
4 Years
299.86%
1.29%
301.15%
5 Years
0%
0%
0.0%

Latest dividend: 2 per share ex-dividend date: Sep-08-2025

Risk Adjusted Returns v/s stock-summary
Returns Beta
Icon
Beta has not been calculated since enough price history is not available
stock-summaryNews & Corporate Actions

News

Announcements stock-summary

Audited Financial Results Of The Company For The Financial Year Ended On March 31 2026.

29-May-2026 | Source : BSE

Please find enclosed herewith Audited Financial Results for the Financial Year ended on March 31 2026.

Audited Financial Results For The FY Ended On March 31 2026

29-May-2026 | Source : BSE

Please find enclosed herewith the Audited Financial Results for the FY ended on March 31 2026.

Board Meeting Outcome for Board Meeting Outcome For Financial Results For The Quarter And Financial Year Ended March 31 2026

29-May-2026 | Source : BSE

We hereby enclose the Audited Standalone and Consolidated Financial Results for the Quarter and Financial Year ended March 31 2026

Corporate Actions stock-summary

stock-summary
BOARD MEETING

No Upcoming Board Meetings

stock-summary
DIVIDEND

Tega Industries Ltd has declared 20% dividend, ex-date: 08 Sep 25

stock-summary
SPLITS

No Splits history available

stock-summary
BONUS

No Bonus history available

stock-summary
RIGHTS

No Rights history available

stock-summaryKey Factors

Quality key factors stock-summary

Factor
Value
Sales Growth (5y)
16.91%
EBIT Growth (5y)
14.82%
EBIT to Interest (avg)
8.89
Debt to EBITDA (avg)
1.20
Net Debt to Equity (avg)
-0.07
Sales to Capital Employed (avg)
0.92
Tax Ratio
21.72%
Dividend Payout Ratio
6.65%
Pledged Shares
0
Institutional Holding
21.11%
ROCE (avg)
19.19%
ROE (avg)
16.45%

Valuation key factors

Factor
Value
P/E Ratio
64
Industry P/E
45
Price to Book Value
8.72
EV to EBIT
56.74
EV to EBITDA
39.75
EV to Capital Employed
9.32
EV to Sales
7.50
PEG Ratio
NA
Dividend Yield
0.10%
ROCE (Latest)
19.59%
ROE (Latest)
16.02%

Technicals key factors

Indicator
Weekly
Monthly
MACD
Bearish
Mildly Bearish
RSI
No Signal
No Signal
Bollinger Bands
Sideways
Sideways
Moving Averages
Mildly Bearish (Daily)
KST
Mildly Bullish
Mildly Bearish
Dow Theory
No Trend
Mildly Bearish
OBV
Mildly Bullish
No Trend
stock-summary Technical Indicator Scale: Bearish, Mildly Bearish, Sideways, Mildly Bullish, Bullish  Turned 
stock-summaryShareholding
Shareholding Snapshot : Mar 2026stock-summary
Shareholding Compare (%holding) stock-summary
Majority shareholders

Promoters

Pledged Promoter Holdings

None

Mutual Funds

Held by 21 Schemes (14.99%)

FIIs

Held by 77 FIIs (2.14%)

Promoter with highest holding

Nihal Fiscal Services Private Limited (49.88%)

Highest Public shareholder

Tata Mutual Fund - Tata Small Cap Fund (5.58%)

Individual Investors Holdings

6.48%

stock-summaryFinancial
[
  {
    "link": "quarterly",
    "btn_text": "All Quarterly Results",
    "header": "Quarterly Results Snapshot (Consolidated) - Mar'26 - QoQ",
    "rhs": [
      {
        "prefix": "Net Sales ",
        "suffix": "QoQ Growth in quarter ended Mar 2026 is 30.48% vs -0.40% in Dec 2025",
        "dir": 1
      },
      {
        "prefix": "Consolidated Net Profit ",
        "suffix": "QoQ Growth in quarter ended Mar 2026 is 116.49% vs -56.14% in Dec 2025",
        "dir": 1
      }
    ],
    "table": {
      "header": [
        "Mar'26",
        "Dec'25",
        "Change(%)"
      ],
      "body": [
        {
          "field": "Net Sales",
          "val1": "526.78",
          "val2": "403.71",
          "chgp": "30.48%",
          "chgp_class": "positive"
        },
        {
          "field": "Operating Profit (PBDIT) excl Other Income",
          "val1": "60.15",
          "val2": "46.19",
          "chgp": "30.22%",
          "chgp_class": "positive"
        },
        {
          "field": "Interest",
          "val1": "5.09",
          "val2": "5.55",
          "chgp": "-8.29%",
          "chgp_class": "positive"
        },
        {
          "field": "Exceptional Items",
          "val1": "0.00",
          "val2": "0.00",
          "chgp": "",
          "chgp_class": "neutral"
        },
        {
          "field": "Consolidate Net Profit",
          "val1": "42.67",
          "val2": "19.71",
          "chgp": "116.49%",
          "chgp_class": "positive"
        },
        {
          "field": "Operating Profit Margin (Excl OI)",
          "val1": "11.42%",
          "val2": "11.44%",
          "chgp": "-0.02%",
          "chgp_class": "negative"
        }
      ]
    }
  },
  {
    "link": "half-yearly",
    "btn_text": "All Half Yearly Results",
    "header": "Half Yearly Results Snapshot (Consolidated) - Sep'25",
    "rhs": [
      {
        "prefix": "Net Sales ",
        "suffix": " Growth in half year ended Sep 2025 is 9.83% vs 7.40% in Sep 2024",
        "dir": 1
      },
      {
        "prefix": "Consolidated Net Profit ",
        "suffix": " Growth in half year ended Sep 2025 is 82.60% vs -36.06% in Sep 2024",
        "dir": 1
      }
    ],
    "table": {
      "header": [
        "Sep'25",
        "Sep'24",
        "Change(%)"
      ],
      "body": [
        {
          "field": "Net Sales",
          "val1": "761.45",
          "val2": "693.28",
          "chgp": "9.83%",
          "chgp_class": "positive"
        },
        {
          "field": "Operating Profit (PBDIT) excl Other Income",
          "val1": "124.81",
          "val2": "98.59",
          "chgp": "26.59%",
          "chgp_class": "positive"
        },
        {
          "field": "Interest",
          "val1": "11.96",
          "val2": "13.50",
          "chgp": "-11.41%",
          "chgp_class": "positive"
        },
        {
          "field": "Exceptional Items",
          "val1": "0.00",
          "val2": "0.00",
          "chgp": "",
          "chgp_class": "neutral"
        },
        {
          "field": "Consolidate Net Profit",
          "val1": "80.27",
          "val2": "43.96",
          "chgp": "82.60%",
          "chgp_class": "positive"
        },
        {
          "field": "Operating Profit Margin (Excl OI)",
          "val1": "16.39%",
          "val2": "14.22%",
          "chgp": "2.17%",
          "chgp_class": "positive"
        }
      ]
    }
  },
  {
    "link": "nine-monthly",
    "btn_text": "All Nine Monthly Results",
    "header": "Nine Monthly Results Snapshot (Consolidated) - Dec'25",
    "rhs": [
      {
        "prefix": "Net Sales ",
        "suffix": "YoY Growth in nine months ended Dec 2025 is 5.68% vs 11.85% in Dec 2024",
        "dir": -1
      },
      {
        "prefix": "Consolidated Net Profit ",
        "suffix": "YoY Growth in nine months ended Dec 2025 is 1.80% vs -5.90% in Dec 2024",
        "dir": 1
      }
    ],
    "table": {
      "header": [
        "Dec'25",
        "Dec'24",
        "Change(%)"
      ],
      "body": [
        {
          "field": "Net Sales",
          "val1": "1,165.16",
          "val2": "1,102.55",
          "chgp": "5.68%",
          "chgp_class": "positive"
        },
        {
          "field": "Operating Profit (PBDIT) excl Other Income",
          "val1": "171.00",
          "val2": "189.91",
          "chgp": "-9.96%",
          "chgp_class": "negative"
        },
        {
          "field": "Interest",
          "val1": "17.51",
          "val2": "19.84",
          "chgp": "-11.74%",
          "chgp_class": "positive"
        },
        {
          "field": "Exceptional Items",
          "val1": "0.00",
          "val2": "0.00",
          "chgp": "",
          "chgp_class": "neutral"
        },
        {
          "field": "Consolidate Net Profit",
          "val1": "99.98",
          "val2": "98.21",
          "chgp": "1.80%",
          "chgp_class": "positive"
        },
        {
          "field": "Operating Profit Margin (Excl OI)",
          "val1": "14.68%",
          "val2": "17.22%",
          "chgp": "-2.54%",
          "chgp_class": "negative"
        }
      ]
    }
  },
  {
    "link": "annual",
    "btn_text": "All Annual Results",
    "header": "Annual Results Snapshot (Consolidated) - Mar'26",
    "rhs": [
      {
        "prefix": "Net Sales ",
        "suffix": "YoY Growth in year ended Mar 2026 is 3.25% vs 9.78% in Mar 2025",
        "dir": -1
      },
      {
        "prefix": "Consolidated Net Profit ",
        "suffix": "YoY Growth in year ended Mar 2026 is -28.72% vs 3.23% in Mar 2025",
        "dir": -1
      }
    ],
    "table": {
      "header": [
        "Mar'26",
        "Mar'25",
        "Change(%)"
      ],
      "body": [
        {
          "field": "Net Sales",
          "val1": "1,691.94",
          "val2": "1,638.65",
          "chgp": "3.25%",
          "chgp_class": "positive"
        },
        {
          "field": "Operating Profit (PBDIT) excl Other Income",
          "val1": "231.15",
          "val2": "339.81",
          "chgp": "-31.98%",
          "chgp_class": "negative"
        },
        {
          "field": "Interest",
          "val1": "22.60",
          "val2": "26.90",
          "chgp": "-15.99%",
          "chgp_class": "positive"
        },
        {
          "field": "Exceptional Items",
          "val1": "0.00",
          "val2": "0.00",
          "chgp": "",
          "chgp_class": "neutral"
        },
        {
          "field": "Consolidate Net Profit",
          "val1": "142.65",
          "val2": "200.12",
          "chgp": "-28.72%",
          "chgp_class": "negative"
        },
        {
          "field": "Operating Profit Margin (Excl OI)",
          "val1": "13.66%",
          "val2": "20.74%",
          "chgp": "-7.08%",
          "chgp_class": "negative"
        }
      ]
    }
  }
]

Quarterly Results Snapshot (Consolidated) - Mar'26 - QoQstock-summary

Mar'26
Dec'25
Change(%)
Net Sales
526.78
403.71
30.48%
Operating Profit (PBDIT) excl Other Income
60.15
46.19
30.22%
Interest
5.09
5.55
-8.29%
Exceptional Items
0.00
0.00
Consolidate Net Profit
42.67
19.71
116.49%
Operating Profit Margin (Excl OI)
11.42%
11.44%
-0.02%
Values in Rs Cr.
Direction Arrows
Net Sales

QoQ Growth in quarter ended Mar 2026 is 30.48% vs -0.40% in Dec 2025

Direction Arrows
Consolidated Net Profit

QoQ Growth in quarter ended Mar 2026 is 116.49% vs -56.14% in Dec 2025

Half Yearly Results Snapshot (Consolidated) - Sep'25stock-summary

Sep'25
Sep'24
Change(%)
Net Sales
761.45
693.28
9.83%
Operating Profit (PBDIT) excl Other Income
124.81
98.59
26.59%
Interest
11.96
13.50
-11.41%
Exceptional Items
0.00
0.00
Consolidate Net Profit
80.27
43.96
82.60%
Operating Profit Margin (Excl OI)
16.39%
14.22%
2.17%
Values in Rs Cr.
Direction Arrows
Net Sales

Growth in half year ended Sep 2025 is 9.83% vs 7.40% in Sep 2024

Direction Arrows
Consolidated Net Profit

Growth in half year ended Sep 2025 is 82.60% vs -36.06% in Sep 2024

Nine Monthly Results Snapshot (Consolidated) - Dec'25stock-summary

Dec'25
Dec'24
Change(%)
Net Sales
1,165.16
1,102.55
5.68%
Operating Profit (PBDIT) excl Other Income
171.00
189.91
-9.96%
Interest
17.51
19.84
-11.74%
Exceptional Items
0.00
0.00
Consolidate Net Profit
99.98
98.21
1.80%
Operating Profit Margin (Excl OI)
14.68%
17.22%
-2.54%
Values in Rs Cr.
Direction Arrows
Net Sales

YoY Growth in nine months ended Dec 2025 is 5.68% vs 11.85% in Dec 2024

Direction Arrows
Consolidated Net Profit

YoY Growth in nine months ended Dec 2025 is 1.80% vs -5.90% in Dec 2024

Annual Results Snapshot (Consolidated) - Mar'26stock-summary

Mar'26
Mar'25
Change(%)
Net Sales
1,691.94
1,638.65
3.25%
Operating Profit (PBDIT) excl Other Income
231.15
339.81
-31.98%
Interest
22.60
26.90
-15.99%
Exceptional Items
0.00
0.00
Consolidate Net Profit
142.65
200.12
-28.72%
Operating Profit Margin (Excl OI)
13.66%
20.74%
-7.08%
Values in Rs Cr.
Direction Arrows
Net Sales

YoY Growth in year ended Mar 2026 is 3.25% vs 9.78% in Mar 2025

Direction Arrows
Consolidated Net Profit

YoY Growth in year ended Mar 2026 is -28.72% vs 3.23% in Mar 2025

stock-summaryCompany CV
About Tega Industries Ltd stock-summary
stock-summary
Tega Industries Ltd
Small Cap
Industrial Manufacturing
Tega Industries Limited was originally incorporated as Tega India Limited on 15 May, 1976 and the Company received a Certificate of Commencement of Business on 28 May 1976. Pursuant to a Special Resolution passed by the Shareholders on 04 January 2002, and with the approval of the Central Government on 31 January 2002, the Company name was changed to Tega Industries Limited on February 1, 2002.
Company Coordinates stock-summary
Icon
No Company Details Available