
Compare Telge Projects with Similar Stocks
Stock DNA
Commercial Services & Supplies
INR 104 Cr (Micro Cap)
12.00
35
0.00%
-0.31
14.19%
2.50
Total Returns (Price + Dividend) 
Telge Projects for the last several years.
Risk Adjusted Returns v/s
Returns Beta

News
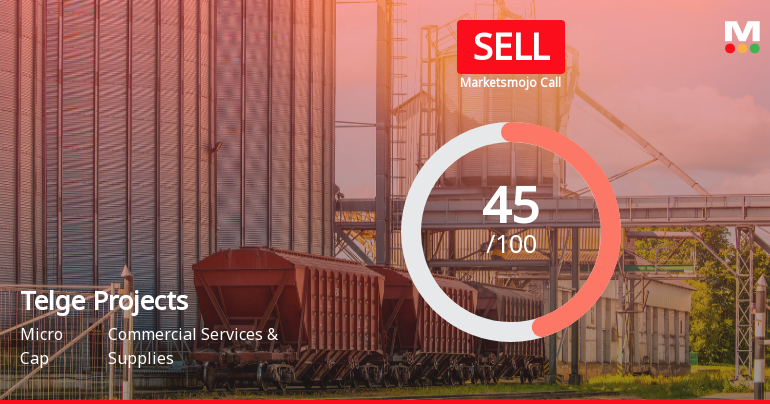
Telge Projects Ltd Downgraded to Sell Amid Technical Weakness Despite Attractive Valuation
Telge Projects Ltd, a micro-cap player in the Commercial Services & Supplies sector, has seen its investment rating downgraded from Hold to Sell as of 2 June 2026. This shift is primarily driven by a deterioration in technical indicators, despite the company’s valuation improving to a very attractive level. Investors are advised to weigh the mixed signals from quality, valuation, financial trends, and technicals before making decisions.
Read full news article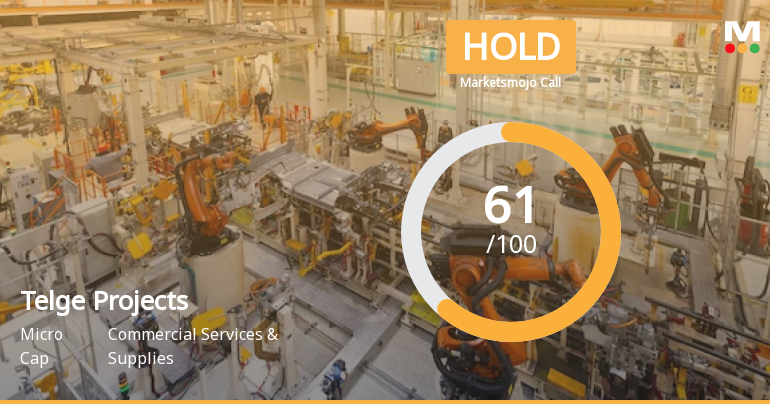
Telge Projects Ltd is Rated Hold by MarketsMOJO
Telge Projects Ltd is rated 'Hold' by MarketsMOJO, with this rating last updated on 25 May 2026. However, the analysis and financial metrics discussed here reflect the stock's current position as of 02 June 2026, providing investors with the most recent insights into the company’s performance and outlook.
Read full news article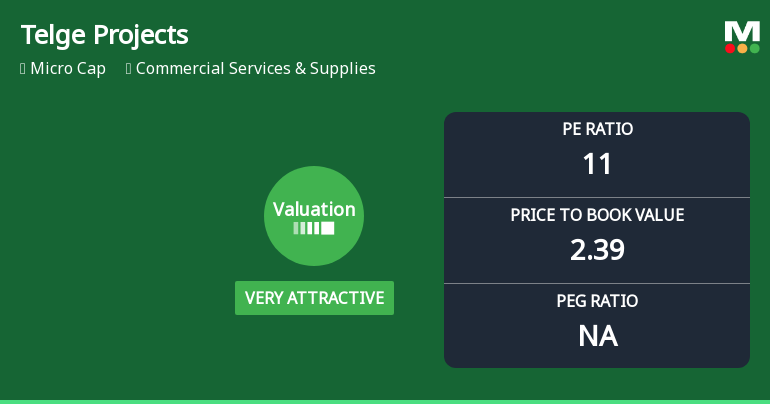
Telge Projects Ltd Valuation Shifts to Very Attractive Amid Market Pressure
Telge Projects Ltd has witnessed a significant improvement in its valuation parameters, shifting from a fair to a very attractive grade, according to the latest analysis. This change comes amid a challenging market backdrop where the stock has underperformed the Sensex over recent weeks, yet its price-to-earnings and price-to-book ratios now present compelling value relative to peers in the Commercial Services & Supplies sector.
Read full news article Announcements
Statement Of Deviation Or Variation For Half Year And Year Ended March 31 2026.
29-May-2026 | Source : BSEStatement of Deviation or Variation for half year and year ended March 31 2026.
Announcement under Regulation 30 (LODR)-Earnings Call Transcript
22-May-2026 | Source : BSEPursuant to Regulation 30 of SEBI (LODR) Regulations 2015 copy of transcript of earnings call held on May 19 2026 for Audited Financial Results for quarter and year ended March 31 2026 is enclosed.
Announcement under Regulation 30 (LODR)-Investor Presentation
19-May-2026 | Source : BSEInvestor Presentation for Financial Year ended March 31 2026.
Corporate Actions

No Upcoming Board Meetings

No Dividend history available

No Splits history available

No Bonus history available

No Rights history available
Quality key factors
Valuation key factors
Technicals key factors
 Technical Indicator Scale: Bearish, Mildly Bearish, Sideways, Mildly Bullish, Bullish Turned
 Shareholding Snapshot : Mar 2026
Shareholding Compare (%holding)
Promoters
None
Held by 0 Schemes
Held by 2 FIIs (1.74%)
Shraddha Shailesh Telge (71.5%)
Aarth Aif Growth Fund (2.76%)
13.98%
Quarterly Results Snapshot (Standalone) - Mar'26 - QoQ

QoQ Growth in quarter ended Mar 2026 is 14.53% vs 10.49% in Dec 2025

QoQ Growth in quarter ended Mar 2026 is 63.46% vs 100.00% in Dec 2025
Half Yearly Results Snapshot (Consolidated) - Mar'26
Growth in half year ended Mar 2026 is 40.20% vs 118.82% in Sep 2025
Growth in half year ended Mar 2026 is 111.92% vs 82.08% in Sep 2025
Nine Monthly Results Snapshot (Standalone) - Dec'25
Not Applicable: The company has declared_date for only one period
Not Applicable: The company has declared_date for only one period
Annual Results Snapshot (Standalone) - Mar'26
YoY Growth in year ended Mar 2026 is 21.86% vs 52.90% in Mar 2025
YoY Growth in year ended Mar 2026 is -29.77% vs 51.09% in Mar 2025
About Telge Projects Ltd

Company Coordinates


