
Compare Tenneco Clean with Similar Stocks
Dashboard
Strong Long Term Fundamental Strength with an average Return on Equity (ROE) of 0%
- The company is Net-Debt Free
Flat results in Mar 26
With ROE of 52.1, it has a Very Expensive valuation with a 19.3 Price to Book Value
High Institutional Holdings at 21.52%
With its market cap of Rs 22,602 cr, it is the second biggest company in the sector (behind Thermax)and constitutes 8.81% of the entire sector
Stock DNA
Industrial Products
INR 23,058 Cr (Small Cap)
37.00
36
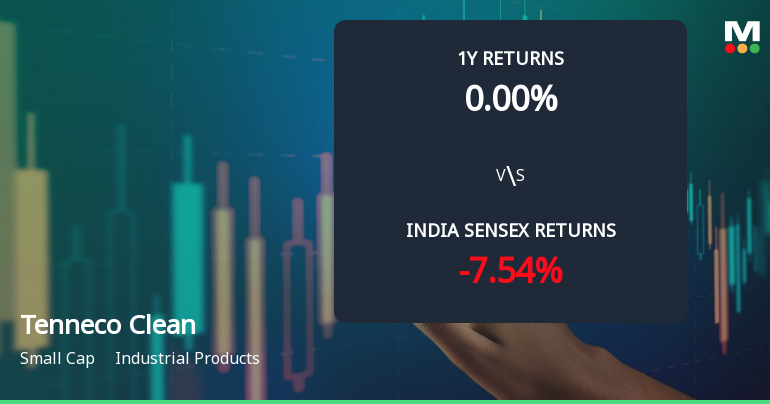
0.00%
-0.43
52.09%
18.88
Total Returns (Price + Dividend) 
Tenneco Clean for the last several years.
Risk Adjusted Returns v/s
Returns Beta

News
Tenneco Clean Air India Ltd Shows Mildly Bullish Momentum Amid Technical Shifts
Tenneco Clean Air India Ltd, a small-cap player in the industrial products sector, has exhibited a notable shift in price momentum, moving from a sideways trend to a mildly bullish stance. Despite mixed signals from key technical indicators such as MACD, RSI, and moving averages, the stock’s recent 3.72% intraday gain to ₹578.30 reflects growing investor interest amid a volatile market backdrop.
Read full news articleAre Tenneco Clean Air India Ltd latest results good or bad?
Tenneco Clean Air India Ltd's latest financial results for Q4 FY26 reflect a notable operational performance. The company reported net sales of ₹1,552.45 crores, which represents a quarter-on-quarter growth of 20.79% and a year-on-year increase of 17.09%. This sequential growth marks the highest quarterly revenue in recent periods, indicating robust demand dynamics in the industrial products segment. Net profit for the same quarter reached ₹166.58 crores, showcasing a significant quarter-on-quarter increase of 40.35% and an 18.87% rise year-on-year. The operating margin remained stable at 16.57%, slightly down from the previous quarter, but the absolute operating profit before depreciation, interest, and tax (excluding other income) rose to ₹257.29 crores, reflecting strong operational execution. The company's return on capital employed (ROCE) was exceptionally high at 142.88%, highlighting superior asset...
Read full news article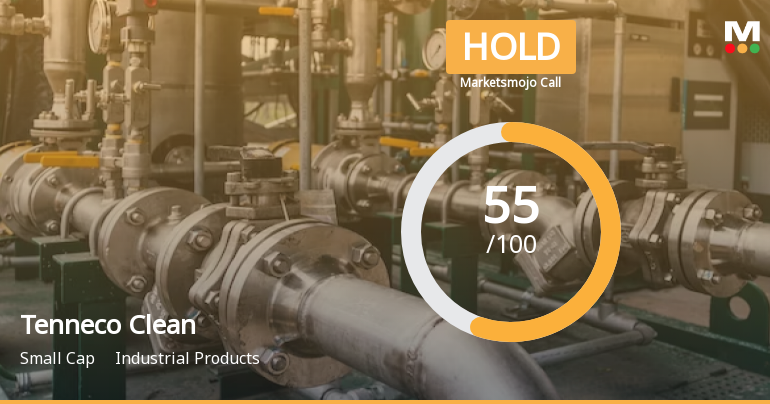
Tenneco Clean Air India Ltd is Rated Hold by MarketsMOJO
Tenneco Clean Air India Ltd is rated 'Hold' by MarketsMOJO, with this rating last updated on 01 June 2026. However, the analysis and financial metrics discussed here reflect the stock’s current position as of 02 June 2026, providing investors with the latest insights into the company’s performance and outlook.
Read full news article Announcements
Announcement under Regulation 30 (LODR)-Earnings Call Transcript
09-Jun-2026 | Source : BSEPlease find enclosed the Earnings Call Transcript
Announcement under Regulation 30 (LODR)-Analyst / Investor Meet - Outcome
03-Jun-2026 | Source : BSEPlease find enclosed the link for Investor Call recording.
Announcement under Regulation 30 (LODR)-Investor Presentation
02-Jun-2026 | Source : BSEPlease find attached the Investor Presentation for the financial results of Q4 and FY26.
Corporate Actions

No Upcoming Board Meetings

No Dividend history available

No Splits history available

No Bonus history available

No Rights history available
Quality key factors
Valuation key factors
Technicals key factors
 Technical Indicator Scale: Bearish, Mildly Bearish, Sideways, Mildly Bullish, Bullish Turned
 Shareholding Snapshot : Mar 2026
Shareholding Compare (%holding)
Promoters
None
Held by 27 Schemes (7.64%)
Held by 53 FIIs (8.94%)
Tenneco Mauritius Holdings Limited (60.22%)
Axis Mutual Fund Trustee Limited A/c Axis Mutual Fund A/c Axis Small Cap Fund (1.65%)
2.59%
Quarterly Results Snapshot (Standalone) - Mar'26 - QoQ

QoQ Growth in quarter ended Mar 2026 is 32.57% vs -6.40% in Dec 2025
QoQ Growth in quarter ended Mar 2026 is 53.03% vs -93.60% in Dec 2025
Half Yearly Results Snapshot (Standalone) - Sep'25
Not Applicable: The company has declared_date for only one period
Not Applicable: The company has declared_date for only one period
Nine Monthly Results Snapshot (Standalone) - Dec'25
Not Applicable: The company has declared_date for only one period
Not Applicable: The company has declared_date for only one period
Annual Results Snapshot (Standalone) - Mar'26
Not Applicable: The company has declared_date for only one period
Not Applicable: The company has declared_date for only one period
About Tenneco Clean Air India Ltd

Company Coordinates


