
Compare Texmaco Infrast. with Similar Stocks
Stock DNA
Diversified Commercial Services
INR 1,446 Cr (Micro Cap)
131.00
34
0.13%
-0.20
1.03%
1.36
Total Returns (Price + Dividend) 
Latest dividend: 0.15 per share ex-dividend date: Sep-12-2025
Risk Adjusted Returns v/s
Returns Beta

News

Texmaco Infrastructure & Holdings Ltd is Rated Sell
Texmaco Infrastructure & Holdings Ltd is rated 'Sell' by MarketsMOJO, with this rating last updated on 03 June 2026. However, the analysis and financial metrics discussed here reflect the stock’s current position as of 18 July 2026, providing investors with the most recent and relevant data to assess the company’s outlook.
Read full news article
Texmaco Infrastructure & Holdings Ltd is Rated Sell
Texmaco Infrastructure & Holdings Ltd is rated 'Sell' by MarketsMOJO, with this rating last updated on 03 June 2026. However, the analysis and financial metrics discussed here reflect the stock’s current position as of 07 July 2026, providing investors with the most up-to-date view of the company’s fundamentals, returns, and market performance.
Read full news article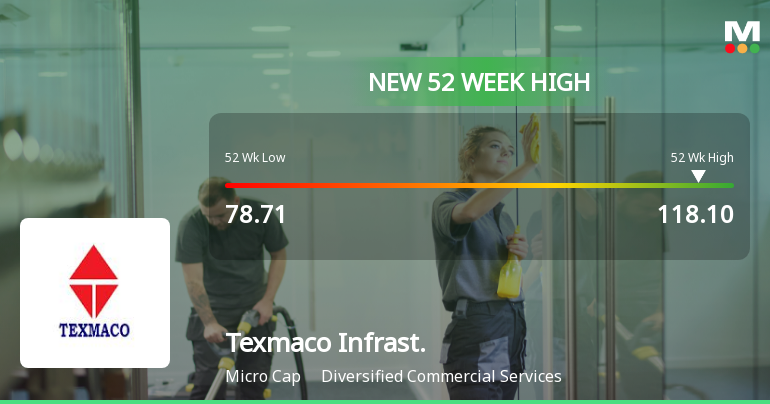
Broad-Based Technical Strength Lifts Texmaco Infrastructure & Holdings Ltd to 52-Week High of Rs 118.1
Surging to a fresh 52-week high of Rs 118.1 on 7 Jul 2026, Texmaco Infrastructure & Holdings Ltd has demonstrated robust price momentum, outperforming its sector by 1.34% today and extending a five-day winning streak that has delivered a 7.32% gain. This milestone caps a year-long rally from a low of Rs 78.71, marking a 50%+ rise that contrasts sharply with the Sensex’s 6.06% decline over the same period.
Read full news article Announcements
Announcement under Regulation 30 (LODR)-Newspaper Publication
14-Jul-2026 | Source : BSECopy of Newspaper Publication
Announcement under Regulation 30 (LODR)-Acquisition
14-Jul-2026 | Source : BSEIntimation of Investment in the shares of its Wholly Owned Subsidiary
Compliances-Certificate under Reg. 74 (5) of SEBI (DP) Regulations 2018
07-Jul-2026 | Source : BSECertificate under Regulation 74 (5) of SEBI (DP) Regulations 2018
Corporate Actions

No Upcoming Board Meetings

Texmaco Infrastructure & Holdings Ltd has declared 15% dividend, ex-date: 12 Sep 25

Texmaco Infrastructure & Holdings Ltd has announced 1:10 stock split, ex-date: 01 Jan 09

No Bonus history available

No Rights history available
Quality key factors
Valuation key factors
Technicals key factors
 Technical Indicator Scale: Bearish, Mildly Bearish, Sideways, Mildly Bullish, Bullish Turned
 Shareholding Snapshot : Jun 2026
Shareholding Compare (%holding)
Promoters
None
Held by 0 Schemes
Held by 15 FIIs (1.71%)
Zuari Industries Limited (20.78%)
Finquest Financial Solutions Pvt. Ltd. (2.25%)
19.16%
Quarterly Results Snapshot (Consolidated) - Mar'26 - YoY

YoY Growth in quarter ended Mar 2026 is 31.23% vs -2.92% in Mar 2025
YoY Growth in quarter ended Mar 2026 is -46.02% vs -54.80% in Mar 2025
Half Yearly Results Snapshot (Consolidated) - Sep'25
Growth in half year ended Sep 2025 is 8.17% vs -2.28% in Sep 2024
Growth in half year ended Sep 2025 is 210.33% vs 25.00% in Sep 2024
Nine Monthly Results Snapshot (Consolidated) - Dec'25
YoY Growth in nine months ended Dec 2025 is 4.30% vs -0.79% in Dec 2024
YoY Growth in nine months ended Dec 2025 is 223.89% vs -390.24% in Dec 2024
Annual Results Snapshot (Consolidated) - Mar'26
YoY Growth in year ended Mar 2026 is 10.02% vs -1.31% in Mar 2025
YoY Growth in year ended Mar 2026 is 251.60% vs -234.26% in Mar 2025
About Texmaco Infrastructure & Holdings Ltd

Company Coordinates


