
Compare Texmaco Infrast. with Similar Stocks
Stock DNA
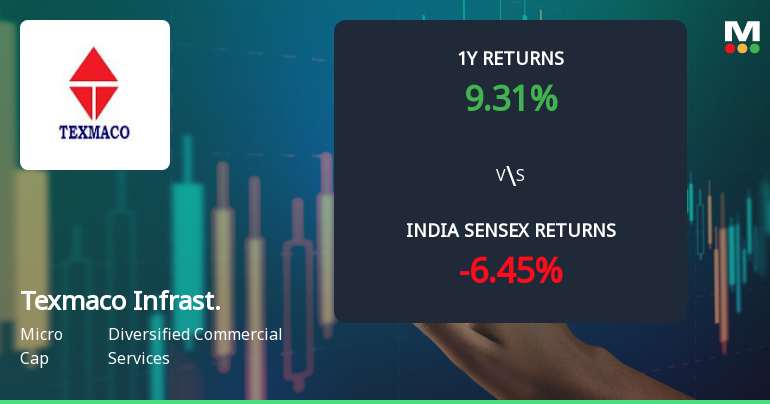
Diversified Commercial Services
INR 1,414 Cr (Micro Cap)
127.00
34
0.14%
-0.20
1.03%
1.32
Total Returns (Price + Dividend) 
Latest dividend: 0.15 per share ex-dividend date: Sep-12-2025
Risk Adjusted Returns v/s
Returns Beta

News
Texmaco Infrastructure & Holdings Ltd Shows Strong Technical Momentum Amid Market Recovery
Texmaco Infrastructure & Holdings Ltd has demonstrated a notable shift in price momentum, supported by a series of bullish technical signals across multiple timeframes. The stock’s recent performance, coupled with upgraded technical indicators, suggests a strengthening trend that investors should carefully analyse amid its micro-cap status and sector dynamics.
Read full news article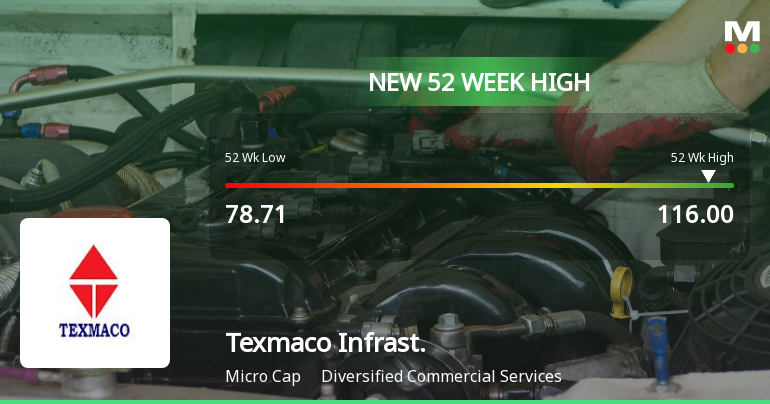
Broad-Based Technical Strength Lifts Texmaco Infrastructure & Holdings Ltd to 52-Week High of Rs 116
With a decisive surge to Rs 116 on 22 Jun 2026, Texmaco Infrastructure & Holdings Ltd has reached a fresh 52-week high, marking a significant milestone in its price momentum. This rally is underscored by a confluence of technical indicators signalling robust upward momentum amid a broadly positive market backdrop.
Read full news article
Texmaco Infrastructure & Holdings Ltd is Rated Sell
Texmaco Infrastructure & Holdings Ltd is rated 'Sell' by MarketsMOJO, with this rating last updated on 03 June 2026. However, the analysis and financial metrics discussed here reflect the stock's current position as of 15 June 2026, providing investors with an up-to-date view of the company’s fundamentals, valuation, financial trends, and technical outlook.
Read full news article Announcements
Texmaco Infrastructure & Holdings Limited - Resignation
22-Nov-2019 | Source : NSETexmaco Infrastructure & Holdings Limited has informed the Exchange regarding Resignation of Mr Pratik Modi as Company Secretary & Compliance Officer of the company w.e.f. November 21, 2019.
Price movement
13-Sep-2019 | Source : NSE
| Significant movement in price has been observed in Texmaco Infrastructure & Holdings Limited. The Exchange, in order to ensure that investors have latest relevant information about the company and to inform the market place so that the interest of the investors is safeguarded, had written to the company. Texmaco Infrastructure & Holdings Limited has submitted their response. |
Shareholders meeting
11-Sep-2019 | Source : NSE
| Texmaco Infrastructure & Holdings Limited has submitted the Exchange a copy Srutinizers report of Annual General Meeting held on September 09, 2019. Further, the company has informed the Exchange regarding voting results. |
Corporate Actions

No Upcoming Board Meetings

Texmaco Infrastructure & Holdings Ltd has declared 15% dividend, ex-date: 12 Sep 25

Texmaco Infrastructure & Holdings Ltd has announced 1:10 stock split, ex-date: 01 Jan 09

No Bonus history available

No Rights history available
Quality key factors
Valuation key factors
Technicals key factors
 Technical Indicator Scale: Bearish, Mildly Bearish, Sideways, Mildly Bullish, Bullish Turned
 Shareholding Snapshot : Mar 2026
Shareholding Compare (%holding)
Promoters
None
Held by 0 Schemes
Held by 14 FIIs (1.51%)
Zuari Industries Limited (20.78%)
Finquest Financial Solutions Pvt. Ltd. (2.27%)
19.67%
Quarterly Results Snapshot (Consolidated) - Mar'26 - YoY

YoY Growth in quarter ended Mar 2026 is 31.23% vs -2.92% in Mar 2025
YoY Growth in quarter ended Mar 2026 is -46.02% vs -54.80% in Mar 2025
Half Yearly Results Snapshot (Consolidated) - Sep'25
Growth in half year ended Sep 2025 is 8.17% vs -2.28% in Sep 2024
Growth in half year ended Sep 2025 is 210.33% vs 25.00% in Sep 2024
Nine Monthly Results Snapshot (Consolidated) - Dec'25
YoY Growth in nine months ended Dec 2025 is 4.30% vs -0.79% in Dec 2024
YoY Growth in nine months ended Dec 2025 is 223.89% vs -390.24% in Dec 2024
Annual Results Snapshot (Consolidated) - Mar'26
YoY Growth in year ended Mar 2026 is 10.02% vs -1.31% in Mar 2025
YoY Growth in year ended Mar 2026 is 251.60% vs -234.26% in Mar 2025
About Texmaco Infrastructure & Holdings Ltd

Company Coordinates


