
Compare Texmaco Infrast. with Similar Stocks
Stock DNA
Diversified Commercial Services
INR 1,259 Cr (Micro Cap)
115.00
31
0.15%
-0.20
1.03%
1.17
Total Returns (Price + Dividend) 
Latest dividend: 0.15 per share ex-dividend date: Sep-12-2025
Risk Adjusted Returns v/s
Returns Beta

News

Texmaco Infrastructure & Holdings Ltd Upgraded to 'Sell' on Technical Improvements
Texmaco Infrastructure & Holdings Ltd has seen its investment rating upgraded from Strong Sell to Sell as of 3 June 2026, driven primarily by a shift in technical indicators despite ongoing fundamental weaknesses. The micro-cap stock, operating within the diversified commercial services sector, has demonstrated a mild bullish technical trend, prompting a reassessment of its outlook. However, challenges remain in its financial health and valuation metrics, which continue to weigh on investor sentiment.
Read full news article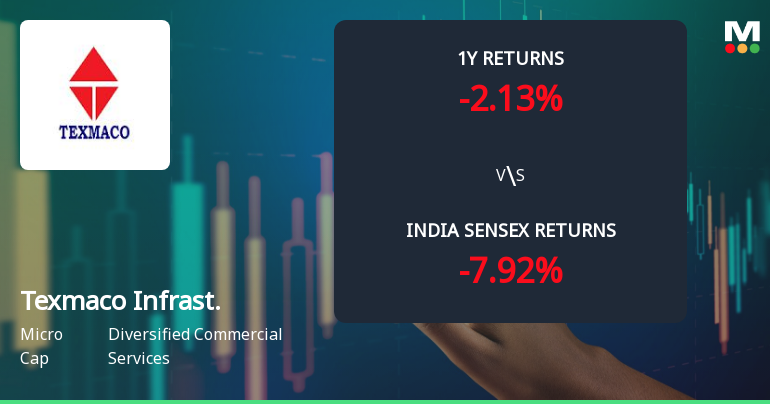
Texmaco Infrastructure & Holdings Ltd Shows Technical Momentum Shift Amid Mixed Market Signals
Texmaco Infrastructure & Holdings Ltd (NSE: 768655) has recently exhibited a notable shift in its technical momentum, moving from a mildly bearish stance to a mildly bullish one. This transition is underscored by a complex interplay of technical indicators, including MACD, RSI, moving averages, and Bollinger Bands, which collectively suggest cautious optimism for investors despite lingering bearish signals on longer timeframes.
Read full news article
Golden Cross Confirmed: Do Texmaco Infrastructure & Holdings Ltd's Other Technical Indicators Agree?
The 50-day moving average has crossed above the 200-day moving average for Texmaco Infrastructure & Holdings Ltd, signalling a golden cross on 3 Jun 2026. Yet, the broader technical and fundamental picture presents a nuanced view that tempers the enthusiasm typically associated with this crossover.
Read full news article Announcements
Compliances-Reg.24(A)-Annual Secretarial Compliance
21-May-2026 | Source : BSESubmission of Annual Secretarial Compliance Report for the year ended 31st March 2026
Standalone And Consolidated Financial Results For The Quarter And Year Ended 31St March 2026
13-May-2026 | Source : BSEStandalone and Consolidated Financial Results for the Quarter and Year ended 31st March 2026
Board Meeting Outcome for Outcome Of Board Meeting
13-May-2026 | Source : BSEOutcome of Board Meeting
Corporate Actions

No Upcoming Board Meetings

Texmaco Infrastructure & Holdings Ltd has declared 15% dividend, ex-date: 12 Sep 25

Texmaco Infrastructure & Holdings Ltd has announced 1:10 stock split, ex-date: 01 Jan 09

No Bonus history available

No Rights history available
Quality key factors
Valuation key factors
Technicals key factors
 Technical Indicator Scale: Bearish, Mildly Bearish, Sideways, Mildly Bullish, Bullish Turned
 Shareholding Snapshot : Mar 2026
Shareholding Compare (%holding)
Promoters
None
Held by 0 Schemes
Held by 14 FIIs (1.51%)
Zuari Industries Limited (20.78%)
Finquest Financial Solutions Pvt. Ltd. (2.27%)
19.67%
Quarterly Results Snapshot (Consolidated) - Mar'26 - YoY

YoY Growth in quarter ended Mar 2026 is 31.23% vs -2.92% in Mar 2025
YoY Growth in quarter ended Mar 2026 is -46.02% vs -54.80% in Mar 2025
Half Yearly Results Snapshot (Consolidated) - Sep'25
Growth in half year ended Sep 2025 is 8.17% vs -2.28% in Sep 2024
Growth in half year ended Sep 2025 is 210.33% vs 25.00% in Sep 2024
Nine Monthly Results Snapshot (Consolidated) - Dec'25
YoY Growth in nine months ended Dec 2025 is 4.30% vs -0.79% in Dec 2024
YoY Growth in nine months ended Dec 2025 is 223.89% vs -390.24% in Dec 2024
Annual Results Snapshot (Consolidated) - Mar'26
YoY Growth in year ended Mar 2026 is 10.02% vs -1.31% in Mar 2025
YoY Growth in year ended Mar 2026 is 251.60% vs -234.26% in Mar 2025
About Texmaco Infrastructure & Holdings Ltd

Company Coordinates


