
Compare Texmaco Rail with Similar Stocks
Dashboard
Company's ability to service its debt is weak with a poor EBIT to Interest (avg) ratio of 1.92
- Company's ability to service its debt is weak with a poor EBIT to Interest (avg) ratio of 1.92
- The company has been able to generate a Return on Equity (avg) of 5.02% signifying low profitability per unit of shareholders funds
Flat results in Mar 26
Falling Participation by Institutional Investors
Underperformed the market in the last 1 year
Stock DNA
Industrial Manufacturing
INR 4,559 Cr (Small Cap)
23.00
32
0.67%
0.20
8.31%
1.88
Total Returns (Price + Dividend) 
Latest dividend: 0.75 per share ex-dividend date: Sep-15-2025
Risk Adjusted Returns v/s
Returns Beta

News

Texmaco Rail & Engineering Ltd is Rated Sell
Texmaco Rail & Engineering Ltd is rated 'Sell' by MarketsMOJO, with this rating last updated on 17 April 2026. However, the analysis and financial metrics discussed here reflect the company’s current position as of 28 July 2026, providing investors with the latest insights into its performance and outlook.
Read full news article
Texmaco Rail & Engineering Ltd is Rated Sell
Texmaco Rail & Engineering Ltd is rated 'Sell' by MarketsMOJO, with this rating last updated on 17 Apr 2026. While the rating change occurred on that date, the analysis and financial metrics discussed here reflect the stock's current position as of 17 July 2026, providing investors with an up-to-date perspective on the company’s performance and outlook.
Read full news article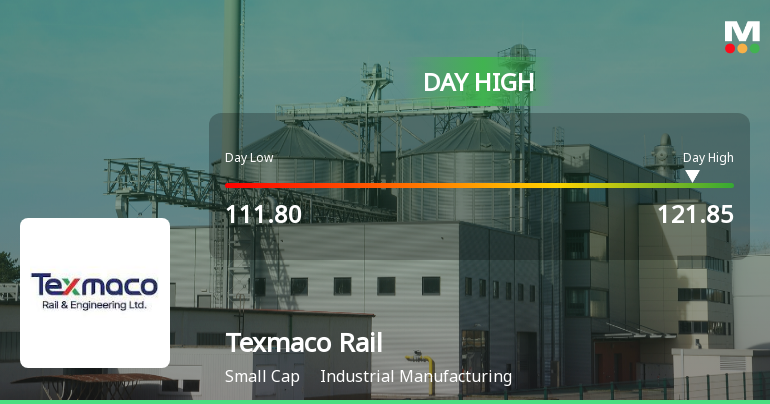
Texmaco Rail & Engineering Ltd Rallies 7.5% and Surpasses All Major Moving Averages
The Sensex advanced 0.63% on 6 Jul 2026, yet Texmaco Rail & Engineering Ltd outperformed markedly, surging 7.51% to touch an intraday high of Rs 121.8. This 7.19 percentage-point outperformance over its sector signals a distinctly stock-specific momentum shift rather than a mere market tailwind.
Read full news article Announcements
Board Meeting Intimation for Consider And Approve The Unaudited Standalone & Consolidated Financial Results Of The Company For The Quarter Ended 30Th June 2026
27-Jul-2026 | Source : BSETexmaco Rail & Engineering Ltdhas informed BSE that the meeting of the Board of Directors of the Company is scheduled on 03/08/2026 inter alia to consider and approve the Unaudited Standalone & Consolidated Financial Results of the Company for the quarter ended 30th June 2026
Announcement Under Regulation 30 (LODR)-Intimation Of Allotment Of Securities In Touax Texmaco Railcar Leasing Private Limited (Joint Venture Company) To The New Joint Venture Partner Namely Trinityrail Global Inc.
24-Jul-2026 | Source : BSEAnnouncement under Regulation 30 (LODR)-Intimation of allotment of securities in Touax Texmaco Railcar Leasing Private Limited (Joint Venture Company) to the new Joint Venture Partner namely TrinityRail Global Inc.
Announcement under Regulation 30 (LODR)-Resignation of Chief Financial Officer (CFO)
14-Jul-2026 | Source : BSEIntimation of resignation of Chief Financial Officer of the Company
Corporate Actions

03 Aug 2026

Texmaco Rail & Engineering Ltd has declared 75% dividend, ex-date: 15 Sep 25

No Splits history available

No Bonus history available

Texmaco Rail & Engineering Ltd has announced 2:7 rights issue, ex-date: 21 Oct 21
Quality key factors
Valuation key factors
Technicals key factors
 Technical Indicator Scale: Bearish, Mildly Bearish, Sideways, Mildly Bullish, Bullish Turned
 Shareholding Snapshot : Jun 2026
Shareholding Compare (%holding)
Promoters
None
Held by 7 Schemes (4.74%)
Held by 60 FIIs (5.01%)
Zuari International Limited (15.67%)
Nippon Life India Trustee Ltd-a/c Nippon India Sma (2.8%)
33.03%
Quarterly Results Snapshot (Consolidated) - Mar'26 - YoY

YoY Growth in quarter ended Mar 2026 is -13.32% vs 17.63% in Mar 2025

YoY Growth in quarter ended Mar 2026 is 45.03% vs -12.25% in Mar 2025
Half Yearly Results Snapshot (Consolidated) - Sep'25
Growth in half year ended Sep 2025 is -10.90% vs 66.50% in Sep 2024
Growth in half year ended Sep 2025 is -28.69% vs 254.79% in Sep 2024
Nine Monthly Results Snapshot (Consolidated) - Dec'25
YoY Growth in nine months ended Dec 2025 is -14.62% vs 59.45% in Dec 2024
YoY Growth in nine months ended Dec 2025 is -34.36% vs 208.45% in Dec 2024
Annual Results Snapshot (Consolidated) - Mar'26
YoY Growth in year ended Mar 2026 is -14.28% vs 45.78% in Mar 2025
YoY Growth in year ended Mar 2026 is -21.68% vs 120.10% in Mar 2025
About Texmaco Rail & Engineering Ltd

Company Coordinates


