
Compare The Byke Hospi. with Similar Stocks
Dashboard
Weak Long Term Fundamental Strength with an average Return on Capital Employed (ROCE) of 3.45%
- Poor long term growth as Net Sales has grown by an annual rate of 10.21% over the last 5 years
- Company's ability to service its debt is weak with a poor EBIT to Interest (avg) ratio of 0.87
Below par performance in long term as well as near term
Total Returns (Price + Dividend) 
Latest dividend: 1 per share ex-dividend date: Sep-18-2018
Risk Adjusted Returns v/s
Returns Beta

News
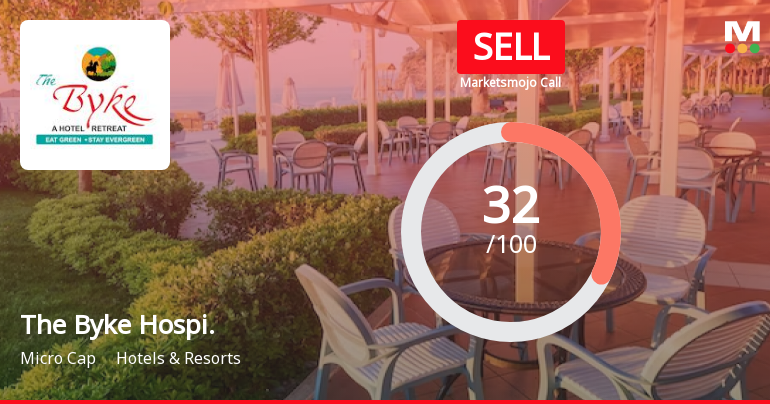
The Byke Hospitality Ltd is Rated Sell
The Byke Hospitality Ltd is rated Sell by MarketsMOJO, with this rating last updated on 04 May 2026. However, the analysis and financial metrics discussed here reflect the stock’s current position as of 16 July 2026, providing investors with an up-to-date view of its performance and outlook.
Read full news article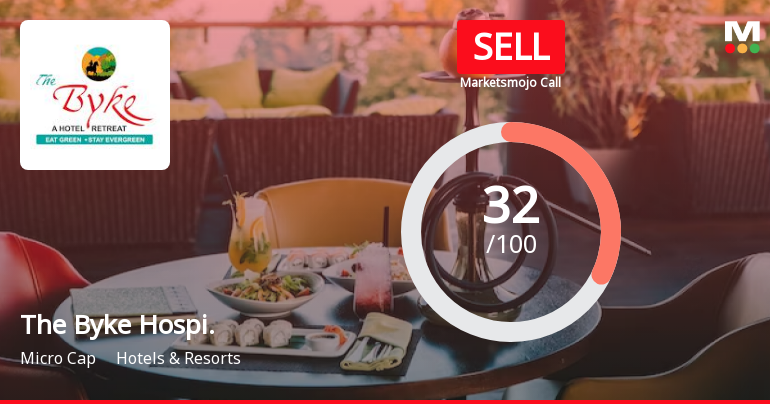
The Byke Hospitality Ltd is Rated Sell
The Byke Hospitality Ltd is rated 'Sell' by MarketsMOJO, with this rating last updated on 04 May 2026. However, all fundamentals, returns, and financial metrics discussed here reflect the stock’s current position as of 05 July 2026, providing investors with the latest comprehensive analysis.
Read full news article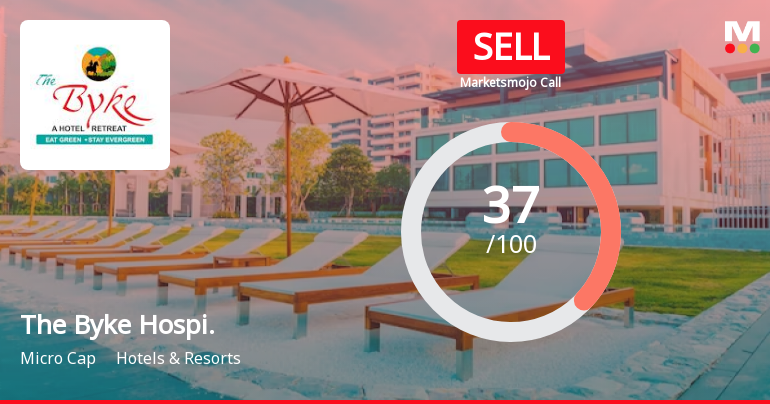
The Byke Hospitality Ltd is Rated Sell
The Byke Hospitality Ltd is rated Sell by MarketsMOJO, with this rating last updated on 04 May 2026. While the rating change occurred on that date, the analysis and financial metrics discussed here reflect the stock’s current position as of 24 June 2026, providing investors with the latest insights into the company’s performance and outlook.
Read full news article Announcements
Compliances-Certificate under Reg. 74 (5) of SEBI (DP) Regulations 2018
14-Jul-2026 | Source : BSECompliance Certificate Under Reg.74(5) of SEBI (DP) Regulations 2018
Closure of Trading Window
26-Jun-2026 | Source : BSEThe Byke Hospitality Limited has informed about the Closure of Trading Window for the Quarter ended June 2026.
Compliances-Reg.24(A)-Annual Secretarial Compliance
29-May-2026 | Source : BSEAnnual Secretarial Compliance Report for the Financial Year ended March 31 2026.
Corporate Actions

No Upcoming Board Meetings

The Byke Hospitality Ltd has declared 10% dividend, ex-date: 18 Sep 18

No Splits history available

The Byke Hospitality Ltd has announced 1:1 bonus issue, ex-date: 09 Oct 14

No Rights history available
Quality key factors
Valuation key factors
Technicals key factors
 Technical Indicator Scale: Bearish, Mildly Bearish, Sideways, Mildly Bullish, Bullish Turned
 Shareholding Snapshot : Mar 2026
Shareholding Compare (%holding)
Non Institution
None
Held by 0 Schemes
Held by 3 FIIs (2.6%)
Hotel Relax Private Ltd. (17.07%)
Florence Agrofoods Llp (3.35%)
38.88%
Quarterly Results Snapshot (Standalone) - Mar'26 - YoY

YoY Growth in quarter ended Mar 2026 is 3.92% vs 16.50% in Mar 2025

YoY Growth in quarter ended Mar 2026 is 118.18% vs -65.78% in Mar 2025
Half Yearly Results Snapshot (Standalone) - Sep'25
Growth in half year ended Sep 2025 is 17.55% vs 9.92% in Sep 2024
Growth in half year ended Sep 2025 is 24.10% vs 16.32% in Sep 2024
Nine Monthly Results Snapshot (Standalone) - Dec'25
YoY Growth in nine months ended Dec 2025 is 12.86% vs 14.76% in Dec 2024
YoY Growth in nine months ended Dec 2025 is 31.33% vs 12.65% in Dec 2024
Annual Results Snapshot (Standalone) - Mar'26
YoY Growth in year ended Mar 2026 is 10.40% vs 15.24% in Mar 2025
YoY Growth in year ended Mar 2026 is 45.97% vs -18.76% in Mar 2025
About The Byke Hospitality Ltd

Company Coordinates


