
Compare The Hi-Tech Gear with Similar Stocks
Dashboard
Weak Long Term Fundamental Strength with a -6.33% CAGR growth in Operating Profits over the last 5 years
- The company has been able to generate a Return on Equity (avg) of 5.86% signifying low profitability per unit of shareholders funds
Negative results in Mar 26
Despite the size of the company, domestic mutual funds hold only 0% of the company
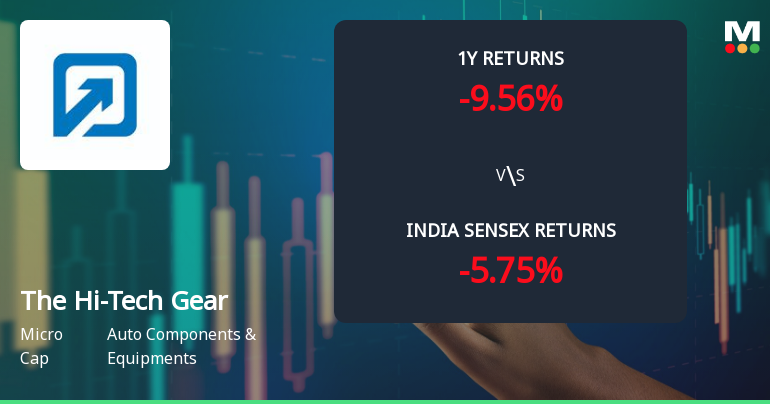
Underperformed the market in the last 1 year
Stock DNA
Auto Components & Equipments
INR 1,112 Cr (Micro Cap)
51.00
37
0.84%
0.28
4.01%
2.14
Total Returns (Price + Dividend) 
Latest dividend: 5 per share ex-dividend date: Sep-19-2025
Risk Adjusted Returns v/s
Returns Beta

News
The Hi-Tech Gears Ltd Faces Bearish Momentum Amid Technical Downgrade
The Hi-Tech Gears Ltd, a micro-cap player in the Auto Components & Equipments sector, has experienced a notable shift in its technical momentum, with recent indicators signalling a bearish trend. The stock’s downgrade from a 'Sell' to a 'Strong Sell' rating by MarketsMOJO on 4 February 2026 reflects growing concerns over its price action and underlying technical health, as it trades down 4.15% today to ₹600.50.
Read full news article
The Hi-Tech Gears Ltd is Rated Strong Sell
The Hi-Tech Gears Ltd is rated Strong Sell by MarketsMOJO, with this rating last updated on 04 Feb 2026. However, the analysis and financial metrics discussed here reflect the company’s current position as of 20 July 2026, providing investors with an up-to-date view of the stock’s fundamentals, valuation, financial trends, and technical outlook.
Read full news article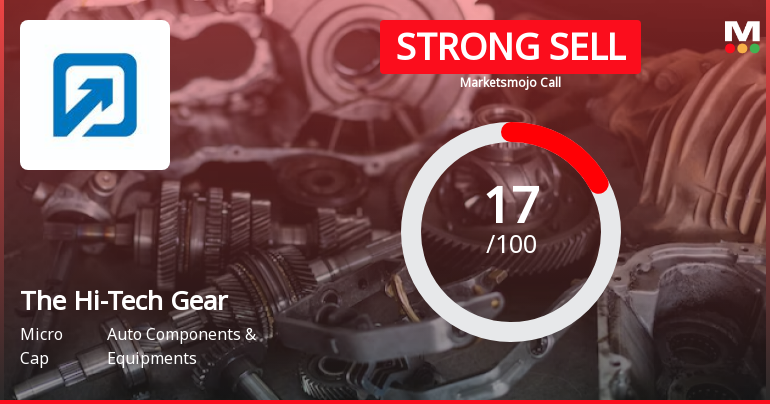
The Hi-Tech Gears Ltd is Rated Strong Sell
The Hi-Tech Gears Ltd is rated Strong Sell by MarketsMOJO, with this rating last updated on 04 February 2026. However, the analysis and financial metrics presented here reflect the company’s current position as of 09 July 2026, providing investors with an up-to-date view of its fundamentals, returns, and overall outlook.
Read full news article Announcements
Compliances-Certificate under Reg. 74 (5) of SEBI (DP) Regulations 2018
06-Jul-2026 | Source : BSECertificate under Reg. 74(5) of SEBI (DP) Regulations 2018
Closure of Trading Window
25-Jun-2026 | Source : BSEClosure of Trading Window
Disclosure Under Regulations 30 Read With Schedule III Of SEBI (LODR) Regulations 2015
19-Jun-2026 | Source : BSEDisclosure under regulation 30 read with Schedule III of SEBI (LODR) Regulations 2015
Corporate Actions

No Upcoming Board Meetings

The Hi-Tech Gears Ltd has declared 50% dividend, ex-date: 19 Sep 25

No Splits history available

The Hi-Tech Gears Ltd has announced 1:1 bonus issue, ex-date: 01 Dec 10

No Rights history available
Quality key factors
Valuation key factors
Technicals key factors
 Technical Indicator Scale: Bearish, Mildly Bearish, Sideways, Mildly Bullish, Bullish Turned
 Shareholding Snapshot : Jun 2026
Shareholding Compare (%holding)
Promoters
None
Held by 0 Schemes
Held by 3 FIIs (0.0%)
Deep Kapuria (16.56%)
Manohar Devabhaktuni (2.06%)
19.31%
Quarterly Results Snapshot (Consolidated) - Mar'26 - QoQ

QoQ Growth in quarter ended Mar 2026 is 2.28% vs -7.15% in Dec 2025
QoQ Growth in quarter ended Mar 2026 is 843.02% vs -85.69% in Dec 2025
Half Yearly Results Snapshot (Consolidated) - Sep'25

Growth in half year ended Sep 2025 is -10.01% vs -7.33% in Sep 2024
Growth in half year ended Sep 2025 is -49.50% vs -70.83% in Sep 2024
Nine Monthly Results Snapshot (Consolidated) - Dec'25
YoY Growth in nine months ended Dec 2025 is -4.53% vs -13.17% in Dec 2024
YoY Growth in nine months ended Dec 2025 is -58.01% vs -68.22% in Dec 2024
Annual Results Snapshot (Consolidated) - Mar'26
YoY Growth in year ended Mar 2026 is -2.00% vs -16.26% in Mar 2025
YoY Growth in year ended Mar 2026 is -48.02% vs -64.67% in Mar 2025
About The Hi-Tech Gears Ltd

Company Coordinates


