
Compare The Invest.Trust with Similar Stocks
Stock DNA
Non Banking Financial Company (NBFC)
INR 499 Cr (Micro Cap)
17.00
21
0.00%
0.08
3.98%
0.68
Total Returns (Price + Dividend) 
Latest dividend: 0.3959114121938509 per share ex-dividend date: Aug-16-2012
Risk Adjusted Returns v/s
Returns Beta

News

The Investment Trust of India Ltd is Rated Strong Sell
The Investment Trust of India Ltd is rated Strong Sell by MarketsMOJO. This rating was last updated on 31 July 2025. However, the analysis and financial metrics discussed below reflect the stock’s current position as of 24 July 2026, providing investors with an up-to-date view of the company’s fundamentals, returns, and market standing.
Read full news article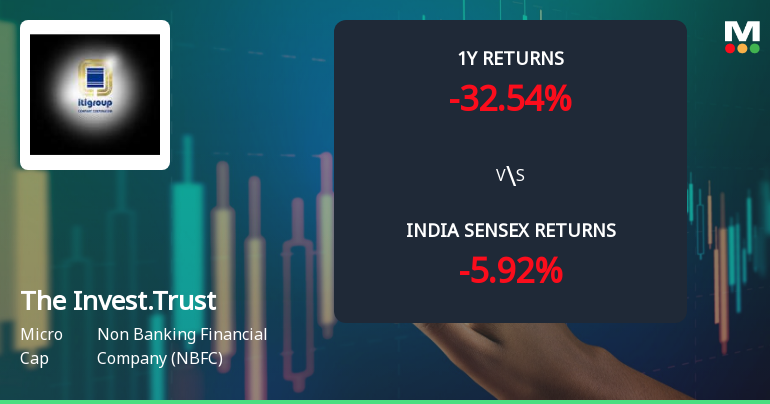
The Investment Trust of India Ltd Faces Bearish Momentum Amid Technical Downturn
The Investment Trust of India Ltd (stock code 668137), a micro-cap player in the Non Banking Financial Company (NBFC) sector, has experienced a notable shift in its technical momentum, signalling increased bearishness despite some mildly bullish weekly indicators. With a current price of ₹100.85, down 1.03% from the previous close of ₹101.90, the stock faces mounting pressure amid a deteriorating technical landscape and underwhelming returns compared to the broader Sensex benchmark.
Read full news article
The Investment Trust of India Ltd is Rated Strong Sell
The Investment Trust of India Ltd is rated Strong Sell by MarketsMOJO. This rating was last updated on 31 July 2025, reflecting a significant reassessment of the stock’s outlook. However, the analysis and financial metrics presented here are based on the company’s current position as of 13 July 2026, providing investors with an up-to-date view of its fundamentals, returns, and market performance.
Read full news article Announcements
Announcement under Regulation 30 (LODR)-Newspaper Publication
17-Jul-2026 | Source : BSEThe Investment Trust of India has informed the Exchange about Copy of Newspaper Publication - Special Window for Transfer and Dematerialisation(Demat) of Physical Shares.
Compliances-Certificate under Reg. 74 (5) of SEBI (DP) Regulations 2018
09-Jul-2026 | Source : BSECompliance Certificate under Reg 74(5) of SEBI (Depositories Participants) Regulations 2018 issued by RTA for the quarter ended 30 June 2026.
Closure of Trading Window
09-Jul-2026 | Source : BSERevised Intimation regarding closure of the Trading Window for the quarter ended 30 June 2026.
Corporate Actions

No Upcoming Board Meetings

The Investment Trust of India Ltd has declared 5% dividend, ex-date: 16 Aug 12

No Splits history available

The Investment Trust of India Ltd has announced 1:1 bonus issue, ex-date: 21 Mar 06

The Investment Trust of India Ltd has announced 4:5 rights issue, ex-date: 08 Feb 16
Quality key factors
Valuation key factors
Technicals key factors
 Technical Indicator Scale: Bearish, Mildly Bearish, Sideways, Mildly Bullish, Bullish Turned
 Shareholding Snapshot : Jun 2026
Shareholding Compare (%holding)
Promoters
None
Held by 0 Schemes
Held by 1 FIIs (6.55%)
Neostar Developers Llp (45.45%)
Elm Park Fund Limited (6.55%)
12.95%
Quarterly Results Snapshot (Consolidated) - Mar'26 - QoQ

QoQ Growth in quarter ended Mar 2026 is -35.42% vs 4.05% in Dec 2025
QoQ Growth in quarter ended Mar 2026 is -48.27% vs 307.90% in Dec 2025
Half Yearly Results Snapshot (Consolidated) - Sep'25
Growth in half year ended Sep 2025 is -18.04% vs 35.40% in Sep 2024
Growth in half year ended Sep 2025 is -63.17% vs 262.50% in Sep 2024
Nine Monthly Results Snapshot (Consolidated) - Dec'25
YoY Growth in nine months ended Dec 2025 is -10.65% vs 28.70% in Dec 2024
YoY Growth in nine months ended Dec 2025 is -34.91% vs 144.39% in Dec 2024
Annual Results Snapshot (Consolidated) - Mar'26
YoY Growth in year ended Mar 2026 is -19.39% vs 22.67% in Mar 2025
YoY Growth in year ended Mar 2026 is -29.27% vs 129.03% in Mar 2025
About The Investment Trust of India Ltd

Company Coordinates


