
Compare The Ramco Cement with Similar Stocks
Dashboard
Weak Long Term Fundamental Strength with a -10.34% CAGR growth in Operating Profits over the last 5 years
- Low ability to service debt as the company has a high Debt to EBITDA ratio of 2.70 times
- The company has been able to generate a Return on Equity (avg) of 5.43% signifying low profitability per unit of shareholders funds
Below par performance in long term as well as near term
Stock DNA
Cement & Cement Products
INR 20,914 Cr (Small Cap)
82.00
34
0.22%
0.45
3.14%
2.60
Total Returns (Price + Dividend) 
Latest dividend: 1.9993031358885016 per share ex-dividend date: Aug-06-2025
Risk Adjusted Returns v/s
Returns Beta

News

The Ramco Cements Ltd is Rated Strong Sell
The Ramco Cements Ltd is rated Strong Sell by MarketsMOJO, with this rating last updated on 02 Apr 2026. However, the analysis and financial metrics discussed here reflect the stock's current position as of 19 June 2026, providing investors with the latest insights into its performance and outlook.
Read full news article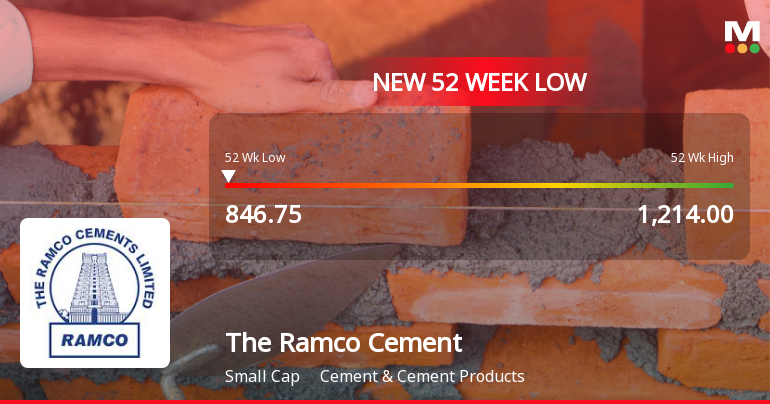
The Ramco Cements Ltd Falls to 52-Week Low of Rs 846.75 as Sell-Off Deepens
For the fourth consecutive session, The Ramco Cements Ltd has closed lower, culminating in a fresh 52-week low of Rs 846.75 on 10 Jun 2026. This decline extends the stock’s year-long underperformance, with a 20.93% drop compared to the Sensex’s 9.84% fall over the same period.
Read full news article
The Ramco Cements Ltd Falls to 52-Week Low of Rs 847.5 as Sell-Off Deepens
For the third consecutive session, The Ramco Cements Ltd has declined, culminating in a fresh 52-week low of Rs 847.5 on 9 June 2026. This marks a 3.5% drop over the last three days, signalling sustained selling pressure despite the broader market showing signs of resilience.
Read full news article Announcements
Announcement under Regulation 30 (LODR)-Change in Management
20-Jun-2026 | Source : BSEList of Senior Management Personnel of the Company approved by the Board of Directors.
Updates On Scheme Of Amalgamation
20-Jun-2026 | Source : BSERamco Windfarms Limited the Transferor Company has filed the second motion petition before the Honourable National Company Law Tribunal Chennai Bench and the same has been numbered on 17.06.2026.
Update On Ongoing Litigations
13-Jun-2026 | Source : BSEUpdate on ongoing litigations
Corporate Actions

No Upcoming Board Meetings

The Ramco Cements Ltd has declared 250% dividend, ex-date: 13 Aug 26

The Ramco Cements Ltd has announced 1:10 stock split, ex-date: 01 Oct 08

The Ramco Cements Ltd has announced 1:1 bonus issue, ex-date: 01 Oct 08

No Rights history available
Quality key factors
Valuation key factors
Technicals key factors
 Technical Indicator Scale: Bearish, Mildly Bearish, Sideways, Mildly Bullish, Bullish Turned
 Shareholding Snapshot : Mar 2026
Shareholding Compare (%holding)
Promoters
22.0601
Held by 26 Schemes (19.04%)
Held by 124 FIIs (8.04%)
Ramco Industries Limited (21.82%)
Life Insurance Corporation Of India And Various Sub Accounts (6.43%)
12.51%
Quarterly Results Snapshot (Consolidated) - Mar'26 - YoY

YoY Growth in quarter ended Mar 2026 is 8.89% vs -10.49% in Mar 2025
YoY Growth in quarter ended Mar 2026 is 449.76% vs -78.76% in Mar 2025
Half Yearly Results Snapshot (Consolidated) - Sep'25
Growth in half year ended Sep 2025 is 4.23% vs -9.80% in Sep 2024
Growth in half year ended Sep 2025 is 158.30% vs -57.07% in Sep 2024
Nine Monthly Results Snapshot (Consolidated) - Dec'25
YoY Growth in nine months ended Dec 2025 is 4.86% vs -8.61% in Dec 2024
YoY Growth in nine months ended Dec 2025 is 123.44% vs 6.21% in Dec 2024
Annual Results Snapshot (Consolidated) - Mar'26
YoY Growth in year ended Mar 2026 is 5.99% vs -9.15% in Mar 2025
YoY Growth in year ended Mar 2026 is 156.24% vs -24.25% in Mar 2025
About The Ramco Cements Ltd

Company Coordinates


