
Compare The Tochigi Bank, Ltd. with Similar Stocks
Dashboard
Weak Long Term Fundamental Strength as the company has not declared results in the last 6 months
- Poor long term growth as Net Interest Income (ex other income) has grown by an annual rate of 0% and Net profit at -265.10%
- Weak Capital Buffers- the bank has a low Capital Adequacy Ratio of 11.46% signifying inadequate buffers against its risk based assets
The company declared very negative results in Mar'25 after positive results in Dec'24
Risky - Negative EBITDA
Market Beating performance in long term as well as near term
Stock DNA
Regional Banks
JPY 95,140 Million (Small Cap)
NA (Loss Making)
NA
0.00%
0.00
-14.19%
0.60
Total Returns (Price + Dividend) 
The Tochigi Bank, Ltd. for the last several years.
Risk Adjusted Returns v/s
News
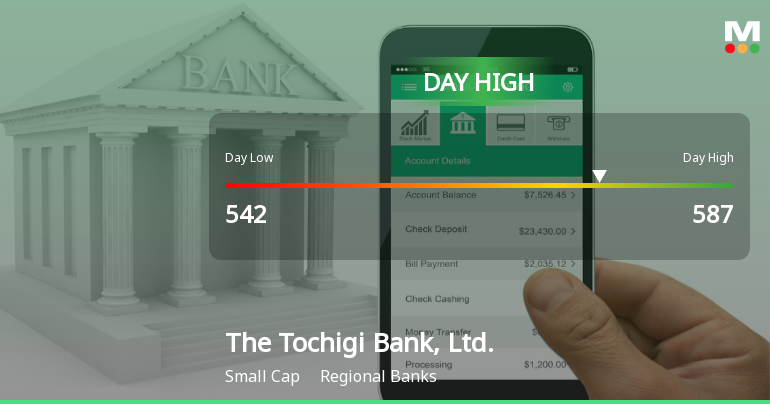
Tochigi Bank Hits Day High with 13.64% Surge, Outperforming Nikkei 225
The Tochigi Bank's stock has seen notable gains, with a 13.64% increase today and a 116.98% rise over the past year, significantly outperforming the Nikkei 225. However, the bank faces challenges, including operating losses and a low capital adequacy ratio, raising concerns about its long-term financial stability.
Read full news article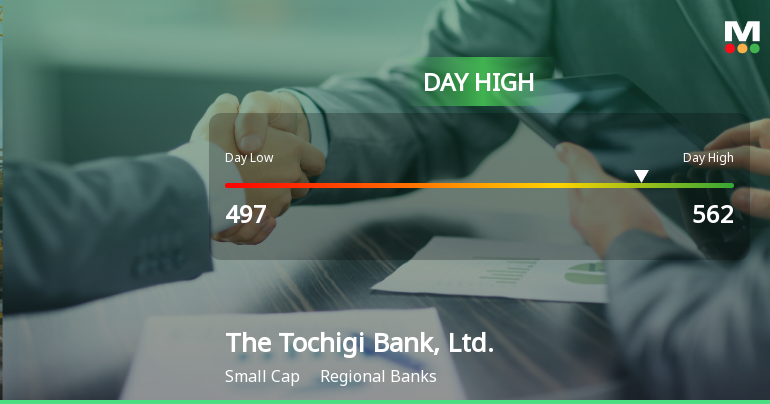
Tochigi Bank Hits Day High with 7.42% Surge Amid Market Decline
Tochigi Bank's stock surged on October 29, 2025, reaching an intraday high and outperforming the Japan Nikkei 225 index. The bank has shown impressive year-to-date gains, though it faces challenges with long-term fundamentals, including declining profits and a low capital adequacy ratio. Its current market cap stands at JPY 53,160 million.
Read full news article Announcements

Corporate Actions
Quality key factors
Valuation key factors
Technicals key factors
 Technical Indicator Scale: Bearish, Mildly Bearish, Sideways, Mildly Bullish, Bullish Turned
 Shareholding Snapshot
Shareholding Compare (%holding)
About The Tochigi Bank, Ltd.

Company Coordinates


