
Compare The Walt Disney Co. with Similar Stocks
Stock DNA
Media & Entertainment
USD 202,077 Million (Large Cap)
19.00
NA
1.12%
0.34
13.14%
1.84
Total Returns (Price + Dividend) 
The Walt Disney Co. for the last several years.
Risk Adjusted Returns v/s
News
Walt Disney Co. Experiences Revision in Its Stock Evaluation Amid Market Dynamics
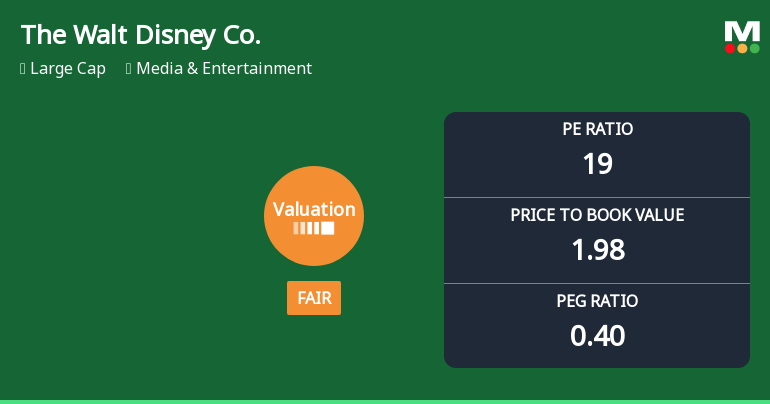
The Walt Disney Co. has adjusted its valuation amid changes in financial metrics and market dynamics. With a P/E ratio of 19 and a low PEG ratio of 0.40, the company faces mixed performance compared to the S&P 500, indicating challenges and the need for strategic enhancements.
Read full news article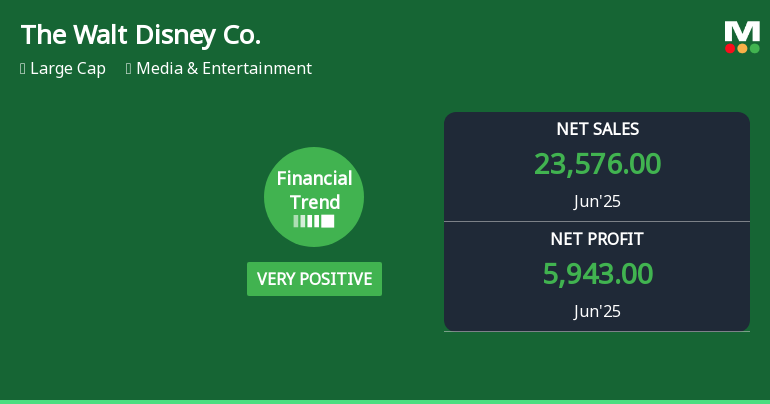
Walt Disney Co. Experiences Revision in Stock Evaluation Amid Financial Trend Adjustments
The Walt Disney Co. reported strong operating cash flow and a record return on capital employed, alongside a low debt-equity ratio, indicating solid financial health. However, challenges include a low inventory turnover ratio and liquidity concerns, as reflected in cash reserves, amidst underperformance compared to the S&P 500.
Read full news articleIs The Walt Disney Co. overvalued or undervalued?
As of 14 November 2025, the valuation grade for The Walt Disney Co. moved from fair to attractive, indicating a more favorable assessment. The company appears undervalued, supported by a P/E ratio of 19, a PEG ratio of 0.40, and an EV to EBITDA ratio of 13.28. In comparison, a peer company has a P/E of 15.26, suggesting that Disney's valuation may be more appealing relative to its peers. Despite recent struggles, with a one-year return of -8.16% compared to the S&P 500's 13.19%, the long-term outlook shows a 3-year return of 15.57%, although this still lags behind the S&P 500's 70.17%. Overall, the current valuation metrics and the grade change indicate that The Walt Disney Co. presents a potentially attractive investment opportunity....
Read full news article Announcements

Corporate Actions
Quality key factors
Valuation key factors
Technicals key factors
 Technical Indicator Scale: Bearish, Mildly Bearish, Sideways, Mildly Bullish, Bullish Turned
 Shareholding Snapshot : Sep 2025
Shareholding Compare (%holding)
Domestic Funds
Held in 246 Schemes (25.91%)
Held by 702 Foreign Institutions (17.34%)
Quarterly Results Snapshot (Consolidated) - Sep'25 - QoQ

QoQ Growth in quarter ended Sep 2025 is -4.59% vs 0.31% in Jun 2025
QoQ Growth in quarter ended Sep 2025 is -75.72% vs 74.74% in Jun 2025
Annual Results Snapshot (Consolidated) - Sep'25

YoY Growth in year ended Sep 2025 is 3.61% vs 2.76% in Sep 2024
YoY Growth in year ended Sep 2025 is 132.65% vs 70.29% in Sep 2024
About The Walt Disney Co.

Company Coordinates


