
Compare Thirani Projects with Similar Stocks
Stock DNA
Non Banking Financial Company (NBFC)
INR 8 Cr (Micro Cap)
19.00
20
0.00%
0.13
3.72%
0.62
Total Returns (Price + Dividend) 
Thirani Projects for the last several years.
Risk Adjusted Returns v/s
Returns Beta

News

Thirani Projects Ltd Valuation Shifts to Very Attractive Amid Market Pressure
Thirani Projects Ltd, a micro-cap player in the Non Banking Financial Company (NBFC) sector, has seen its valuation parameters shift markedly, with price-to-earnings (P/E) and price-to-book value (P/BV) ratios moving into very attractive territory despite recent share price declines. This article analyses the evolving valuation landscape for Thirani Projects, contrasting it with peer averages and historical benchmarks to assess its price attractiveness and investment implications.
Read full news article
Thirani Projects Ltd Valuation Shifts Signal Renewed Price Attractiveness Amid NBFC Sector Dynamics
Thirani Projects Ltd, a micro-cap player in the Non Banking Financial Company (NBFC) sector, has seen its valuation parameters improve notably, shifting from very attractive to attractive. Despite a stagnant share price at ₹4.18 and a challenging sector backdrop, the company’s price-to-earnings (P/E) and price-to-book value (P/BV) ratios suggest a compelling entry point relative to peers and historical averages.
Read full news article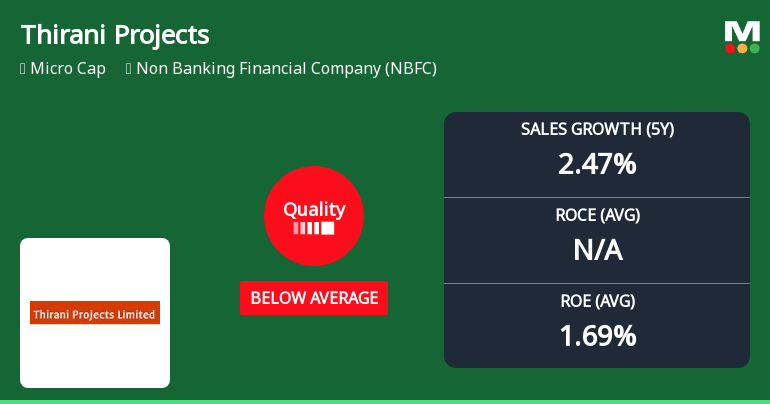
Thirani Projects Ltd Quality Grade Downgrade Highlights Fundamental Challenges
Thirani Projects Ltd, a micro-cap player in the Non Banking Financial Company (NBFC) sector, has seen its quality grade downgraded from 'Does Not Qualify' to 'Below Average' as of 1 June 2026. This shift reflects a deterioration in key business fundamentals including return on equity, sales growth, and institutional interest, raising concerns about the company’s operational consistency and financial health.
Read full news article Announcements
Announcement under Regulation 30 (LODR)-Newspaper Publication
02-Jun-2026 | Source : BSENewspaper Result for Audited Financial Result for the year ended 31st March 2026
Announcement under Regulation 30 (LODR)-Dividend Updates
29-May-2026 | Source : BSEThe Company has not declared the dividend for the FY 2025-2026
Results-Financial Results For 31St March 2026
29-May-2026 | Source : BSEresults-financial results for 31st March 2026
Corporate Actions

No Upcoming Board Meetings

No Dividend history available

No Splits history available

No Bonus history available

No Rights history available
Quality key factors
Valuation key factors
Technicals key factors
 Technical Indicator Scale: Bearish, Mildly Bearish, Sideways, Mildly Bullish, Bullish Turned
 Shareholding Snapshot : Mar 2026
Shareholding Compare (%holding)
Non Institution
None
Held by 0 Schemes
Held by 0 FIIs
None
Mukesh Commercial (5.66%)
41.5%
Quarterly Results Snapshot (Standalone) - Mar'26 - YoY

YoY Growth in quarter ended Mar 2026 is 16.67% vs 20.00% in Mar 2025
YoY Growth in quarter ended Mar 2026 is -88.24% vs 107.68% in Mar 2025
Half Yearly Results Snapshot (Standalone) - Sep'25

Growth in half year ended Sep 2025 is 20.00% vs -4.76% in Sep 2024
Growth in half year ended Sep 2025 is 127.27% vs -26.67% in Sep 2024
Nine Monthly Results Snapshot (Standalone) - Dec'25
YoY Growth in nine months ended Dec 2025 is 21.31% vs -3.17% in Dec 2024
YoY Growth in nine months ended Dec 2025 is 78.26% vs -14.81% in Dec 2024
Annual Results Snapshot (Standalone) - Mar'26
YoY Growth in year ended Mar 2026 is 20.00% vs 2.41% in Mar 2025
YoY Growth in year ended Mar 2026 is -37.33% vs 111.76% in Mar 2025
About Thirani Projects Ltd

Company Coordinates


