
Compare Tidewater Renewables Ltd. with Similar Stocks
Dashboard
Poor Management Efficiency with a low ROCE of 6.82%
- The company has been able to generate a Return on Capital Employed (avg) of 6.82% signifying low profitability per unit of total capital (equity and debt)
Low ability to service debt as the company has a high Debt to EBITDA ratio of 6.19 times
Negative results in Jun 25
Risky -
Stock DNA
Specialty Chemicals
CAD 158 Million (Small Cap)
NA (Loss Making)
NA
0.00%
1.08
-4.06%
0.93
Total Returns (Price + Dividend) 
Tidewater Renewables Ltd. for the last several years.
Risk Adjusted Returns v/s
News
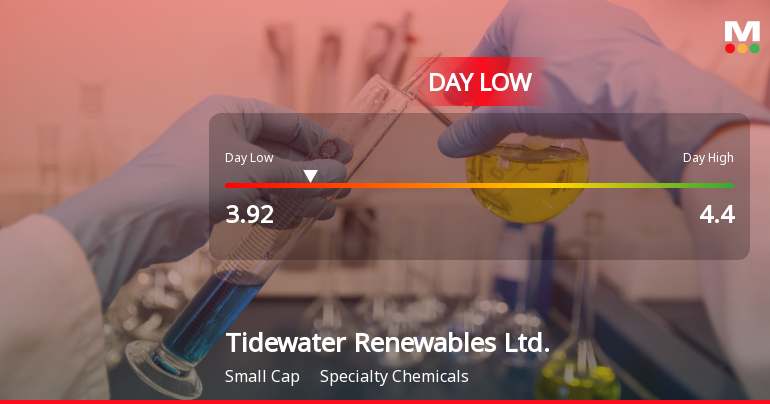
Tidewater Renewables Hits Day Low at CAD 3.92 Amid Price Pressure
Tidewater Renewables, a small-cap specialty chemicals company, saw its stock decline significantly today, reflecting ongoing challenges. Despite a strong year-to-date performance, the company faces hurdles such as a high Debt to EBITDA ratio and low profitability, alongside a market capitalization of CAD 142 million and recent net profit losses.
Read full news article Announcements

Corporate Actions
Quality key factors
Valuation key factors
Technicals key factors
 Technical Indicator Scale: Bearish, Mildly Bearish, Sideways, Mildly Bullish, Bullish Turned
 Shareholding Snapshot
Shareholding Compare (%holding)
Quarterly Results Snapshot (Consolidated) - Jun'25 - QoQ

QoQ Growth in quarter ended Jun 2025 is 27.56% vs -24.48% in Mar 2025

QoQ Growth in quarter ended Jun 2025 is 150.00% vs 252.94% in Mar 2025
Annual Results Snapshot (Consolidated) - Dec'24
YoY Growth in year ended Dec 2024 is 336.54% vs 28.38% in Dec 2023
YoY Growth in year ended Dec 2024 is -772.68% vs -258.30% in Dec 2023
About Tidewater Renewables Ltd.

Company Coordinates


