
Compare Timex Group with Similar Stocks
Dashboard
Strong ability to service debt as the company has a low Debt to EBITDA ratio of 0.05 times
Healthy long term growth as Net Sales has grown by an annual rate of 41.48% and Operating profit at 77.31%
With a growth in Net Profit of 195.89%, the company declared Outstanding results in Mar 26
Market Beating performance in long term as well as near term
Stock DNA
Gems, Jewellery And Watches
INR 4,997 Cr (Small Cap)
63.00
42
0.00%
-0.25
71.13%
44.78
Total Returns (Price + Dividend) 
Timex Group for the last several years.
Risk Adjusted Returns v/s
Returns Beta

News
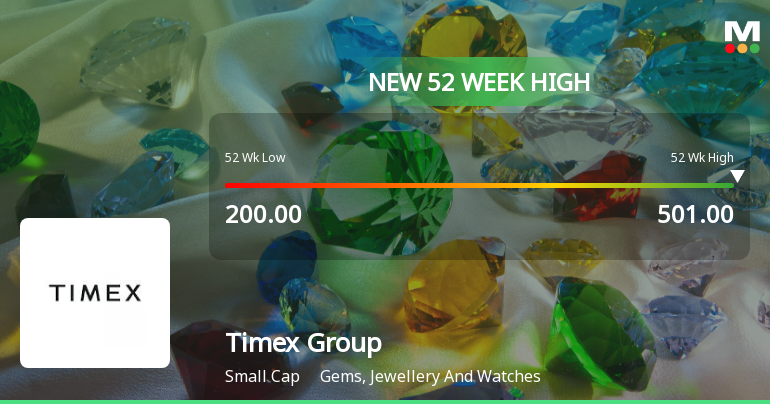
Broad-Based Technical Strength Lifts Timex Group India Ltd to 52-Week High of Rs 501
With a remarkable ascent from Rs 200 to Rs 501 over the past year, Timex Group India Ltd has surged 81.37%, outpacing the Sensex which declined by 5.46% in the same period. This milestone reflects a powerful momentum driven by a confluence of technical indicators aligning strongly across multiple timeframes.
Read full news article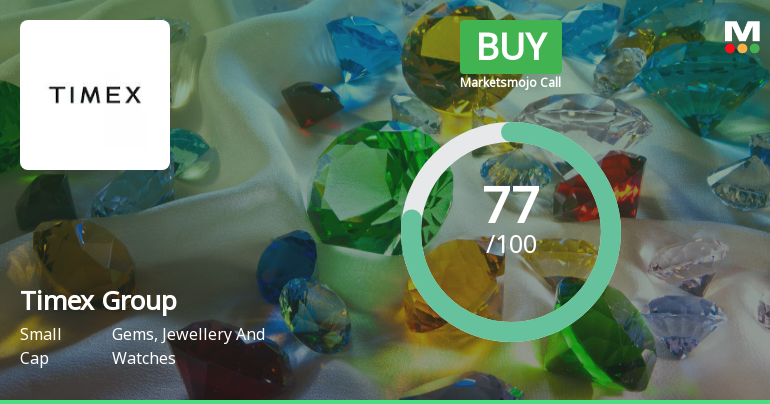
Timex Group India Ltd Downgraded to Buy Amid Expensive Valuation Despite Strong Financials
Timex Group India Ltd’s investment rating has been revised from Strong Buy to Buy as of 12 June 2026, primarily driven by a reassessment of its valuation metrics despite continued robust financial performance and positive technical indicators. This recalibration reflects a nuanced view of the company’s current market standing within the Gems, Jewellery and Watches sector.
Read full news article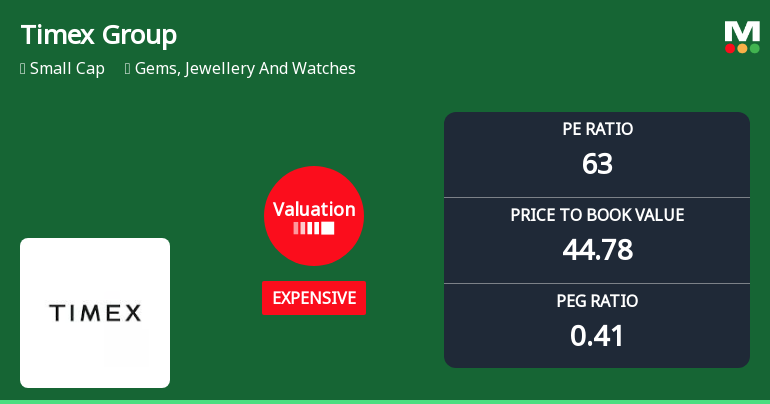
Timex Group India Ltd Valuation Shifts Amidst Strong Market Performance
Timex Group India Ltd has witnessed a significant shift in its valuation parameters, moving from a fair to an expensive rating, even as its stock price surged by over 8% in a single day. This change reflects evolving market perceptions amid robust returns that have outpaced the broader Sensex over multiple time frames.
Read full news article Announcements
Compliances-Reg.24(A)-Annual Secretarial Compliance
28-May-2026 | Source : BSEPlease find attached Annual Secretarial Compliance Report for the Financial Year ended March 312026.
Announcement under Regulation 30 (LODR)-Newspaper Publication
28-May-2026 | Source : BSEPlease find attached copies of Newspaper Advertisement regarding Financials Results of the Company for the quarter and year ended on March 312026 published on May 282026 in Business Standard (English) in New Delhi and Mumbai edition and Business Standard (Hindi) in New Delhi edition.
Announcement under Regulation 30 (LODR)-Press Release / Media Release
26-May-2026 | Source : BSEPlease find attached letter for press release.
Corporate Actions

No Upcoming Board Meetings

No Dividend history available

No Splits history available

No Bonus history available

No Rights history available
Quality key factors
Valuation key factors
Technicals key factors
 Technical Indicator Scale: Bearish, Mildly Bearish, Sideways, Mildly Bullish, Bullish Turned
 Shareholding Snapshot : Mar 2026
Shareholding Compare (%holding)
Promoters
None
Held by 7 Schemes (0.06%)
Held by 15 FIIs (1.32%)
Timex Group Luxury Watches Bv (51.0%)
Chetan Jayantilal Shah (2.38%)
34.47%
Quarterly Results Snapshot (Standalone) - Mar'26 - YoY

YoY Growth in quarter ended Mar 2026 is 73.69% vs 47.09% in Mar 2025
YoY Growth in quarter ended Mar 2026 is 195.89% vs 30.51% in Mar 2025
Half Yearly Results Snapshot (Standalone) - Sep'25
Growth in half year ended Sep 2025 is 45.93% vs 21.53% in Sep 2024
Growth in half year ended Sep 2025 is 121.84% vs 32.72% in Sep 2024
Nine Monthly Results Snapshot (Standalone) - Dec'25
YoY Growth in nine months ended Dec 2025 is 39.91% vs 23.20% in Dec 2024
YoY Growth in nine months ended Dec 2025 is 116.86% vs 61.19% in Dec 2024
Annual Results Snapshot (Standalone) - Mar'26
YoY Growth in year ended Mar 2026 is 48.41% vs 28.45% in Mar 2025
YoY Growth in year ended Mar 2026 is 140.10% vs 50.77% in Mar 2025
About Timex Group India Ltd

Company Coordinates


