
Compare Tirupati Foam with Similar Stocks
Dashboard
Weak Long Term Fundamental Strength with a -0.89% CAGR growth in Operating Profits over the last 5 years
- Low ability to service debt as the company has a high Debt to EBITDA ratio of 4.84 times
- The company has been able to generate a Return on Equity (avg) of 6.15% signifying low profitability per unit of shareholders funds
Flat results in Mar 26
Below par performance in long term as well as near term
Stock DNA
Furniture, Home Furnishing
INR 27 Cr (Micro Cap)
14.00
32
1.64%
1.14
5.91%
0.83
Total Returns (Price + Dividend) 
Latest dividend: 1 per share ex-dividend date: Sep-22-2025
Risk Adjusted Returns v/s
Returns Beta

News
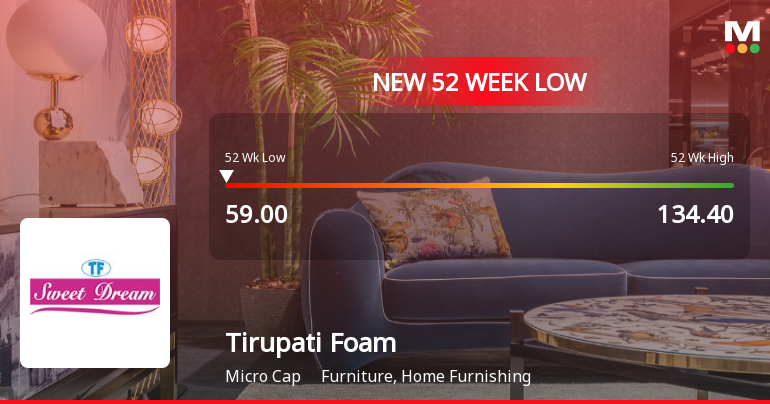
Tirupati Foam Ltd Falls to 52-Week Low of Rs 59 as Sell-Off Deepens
For the second consecutive session, Tirupati Foam Ltd closed lower, hitting a fresh 52-week low of Rs 59 on 19 Jun 2026, marking a sharp decline of 3.28% intraday. This move extends the stock’s downward trajectory, which has seen a 7.1% loss over the past two days, significantly underperforming its sector and the broader market indices.
Read full news article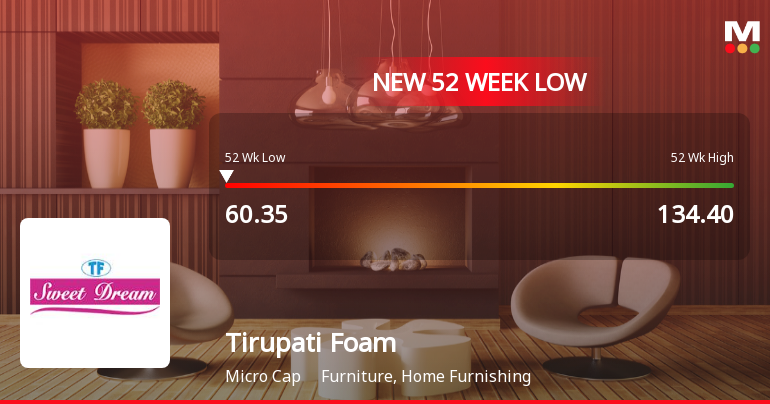
Tirupati Foam Ltd Falls to 52-Week Low of Rs 60.35 as Sell-Off Deepens
A sharp decline of 4.98% today dragged Tirupati Foam Ltd to a fresh 52-week low of Rs 60.35, extending a downward trajectory that has seen the stock lose over 38% in the past year. This fall comes despite a broadly stable market environment, highlighting stock-specific pressures that continue to weigh on investor sentiment.
Read full news article
Tirupati Foam Ltd Falls to 52-Week Low of Rs 62.5 as Sell-Off Deepens
For the eighth consecutive session, Tirupati Foam Ltd has closed lower, culminating in a fresh 52-week low of Rs 62.5 on 12 Jun 2026. This marks a steep 32.43% decline over this losing streak, sharply underperforming its sector and the broader market.
Read full news article Announcements
Board Meeting Outcome for As Per Agenda Enclosed
29-May-2026 | Source : BSE1. Approved the Audited standalone Financial Results for the fourth quarter and year ended on 31st March 2026 as recommended by the Audit Committee; Pursuant to Regulation 33 and other applicable regulations of the Listing Regulations the Audited Financial Results for the quarter and year ended March 31 2026 together with the Auditors Report with unmodified opinions on the aforesaid Audited Financial Results is enclosed herewith as Annexure Declaration for Auditors Report with unmodified opinions on the aforesaid Audited Financial Results pursuant to Regulation 33(3)(d) of the Securities and Exchange Board of India (Listing Obligations and Disclosure Requirements) Regulations 2015 is enclosed herewith as Annexure. 2. Approved Change in Category of Non-Executive Directors and Non-Independent Directors over MCA Portal 3. Took note of Omnibus Approval of Non-Material Related Party Transactions by Audit Committee of the Company
Announcement under Regulation 30 (LODR)-Newspaper Publication
29-May-2026 | Source : BSEAs per Attachment
Audited Results For Fy 2025-2026 Along With Audit Report And Declaration Of Unmodified Opinion
29-May-2026 | Source : BSEAs per attachment
Corporate Actions

No Upcoming Board Meetings

Tirupati Foam Ltd has declared 10% dividend, ex-date: 22 Sep 25

No Splits history available

No Bonus history available

No Rights history available
Quality key factors
Valuation key factors
Technicals key factors
 Technical Indicator Scale: Bearish, Mildly Bearish, Sideways, Mildly Bullish, Bullish Turned
 Shareholding Snapshot : Mar 2026
Shareholding Compare (%holding)
Promoters
None
Held by 0 Schemes
Held by 0 FIIs
Dhirajben B Kothari (4.83%)
Amitkumar Mehta (2.61%)
22.88%
Quarterly Results Snapshot (Standalone) - Mar'26 - QoQ

QoQ Growth in quarter ended Mar 2026 is -1.61% vs 8.30% in Dec 2025

QoQ Growth in quarter ended Mar 2026 is 15.91% vs -20.00% in Dec 2025
Half Yearly Results Snapshot (Standalone) - Sep'25
Growth in half year ended Sep 2025 is -4.00% vs 0.74% in Sep 2024
Growth in half year ended Sep 2025 is 5.43% vs -5.15% in Sep 2024
Nine Monthly Results Snapshot (Standalone) - Dec'25
YoY Growth in nine months ended Dec 2025 is -9.78% vs 2.25% in Dec 2024
YoY Growth in nine months ended Dec 2025 is -7.24% vs -3.80% in Dec 2024
Annual Results Snapshot (Standalone) - Mar'26
YoY Growth in year ended Mar 2026 is -10.39% vs 1.96% in Mar 2025
YoY Growth in year ended Mar 2026 is -10.28% vs 1.90% in Mar 2025
About Tirupati Foam Ltd

Company Coordinates


