
Compare Titan Biotech with Similar Stocks
Dashboard
Company has a Debt to Equity ratio (avg) of 0.02 times
Poor long term growth as Operating profit has grown by an annual rate -5.17% of over the last 5 years
With a growth in Operating Profit of 98.66%, the company declared Very Positive results in Mar 26
With ROE of 16.5, it has a Very Expensive valuation with a 10.2 Price to Book Value
Despite the size of the company, domestic mutual funds hold only 0% of the company
Stock DNA
Specialty Chemicals
INR 1,847 Cr (Micro Cap)
62.00
41
0.09%
0.02
16.46%
10.07
Total Returns (Price + Dividend) 
Latest dividend: 2 per share ex-dividend date: Sep-19-2025
Risk Adjusted Returns v/s
Returns Beta

News
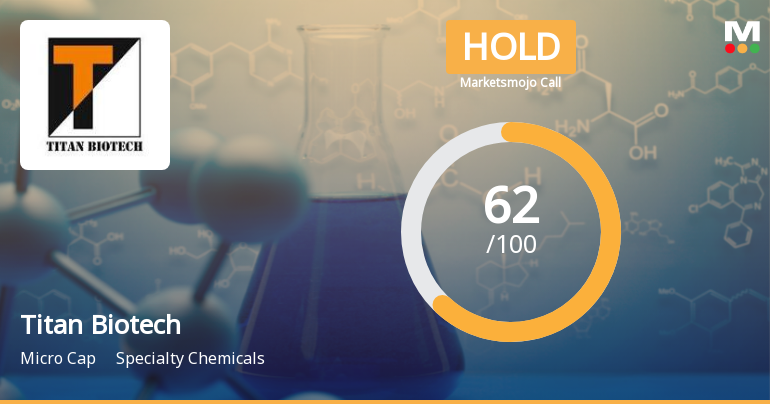
Titan Biotech Ltd Downgraded to Hold Amid Mixed Technical and Valuation Signals
Titan Biotech Ltd, a micro-cap player in the Specialty Chemicals sector, has seen its investment rating downgraded from Buy to Hold as of 8 June 2026. This revision reflects a nuanced assessment across four key parameters: quality, valuation, financial trend, and technical indicators. Despite robust recent financial performance and impressive long-term returns, evolving technical signals and valuation concerns have tempered the overall outlook.
Read full news article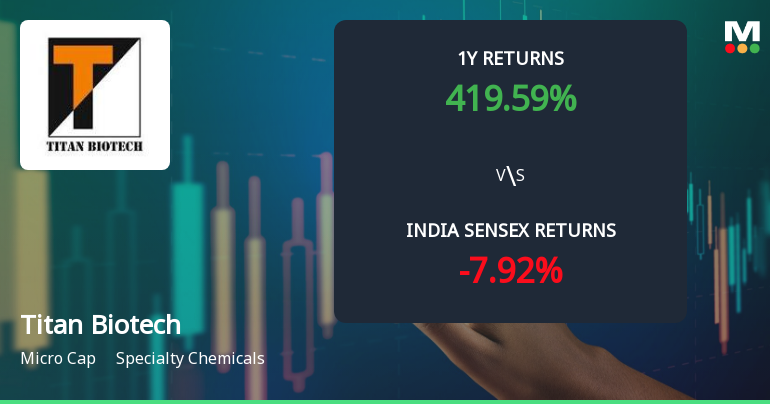
Titan Biotech Ltd Technical Momentum Shifts Amid Mixed Indicator Signals
Titan Biotech Ltd, a micro-cap player in the specialty chemicals sector, has experienced a nuanced shift in its technical momentum, reflecting a complex interplay of bullish and bearish signals across key indicators. Despite a recent downgrade in daily price performance, the company’s long-term returns remain robust, prompting a reassessment of its technical outlook and investment potential.
Read full news articleAre Titan Biotech Ltd latest results good or bad?
Titan Biotech Ltd's latest financial results for Q4 FY26 reveal a mixed operational performance characterized by significant year-on-year growth alongside sequential declines. The consolidated net profit reached ₹6.73 crores, reflecting a notable year-on-year increase of 66.17%. However, this figure represents a decline of 21.10% compared to the previous quarter. Similarly, net sales for the quarter amounted to ₹48.83 crores, which is a substantial year-on-year growth of 38.84%, yet it shows a sequential decrease of 13.59% from Q3 FY26. The operating margin for the quarter stood at 19.89%, marking a significant improvement of 690 basis points from the same quarter last year, indicating effective cost management and operational leverage despite inflationary pressures. The average return on equity (ROE) of 21.23% demonstrates strong capital efficiency, positioning the company favorably within its industry. ...
Read full news article Announcements
Announcement under Regulation 30 (LODR)-Newspaper Publication
01-Jun-2026 | Source : BSENewspaper publication of the Audited Financial Results (Standalone & Consolidated) for fourth quarter and year ended March 31 2026
Board Meeting Outcome for Outcome Of The Board Meeting Of Titan Biotech Limited Held Today I.E. 30Th May 2026
30-May-2026 | Source : BSEPursuant to Regulation 30 of the SEBI (Listing Obligations and Disclosure Requirements) Regulations 2015 we wish to inform you that the Board of Directors at its meeting held today i.e. Saturday 30th May 2026 Approval of Audited Financial Results For The Fourth Quarter And Year Ended 31st March 2026 Recommendation of Dividend re appointment of Cost Auditor and Appointment of Scrutinizer
Corporate Action-Board to consider Dividend
30-May-2026 | Source : BSEThe Board of Director of the Company has recommended a dividend of Rs. 0.50 paisa per Equity Share
Corporate Actions

No Upcoming Board Meetings

Titan Biotech Ltd has declared 20% dividend, ex-date: 19 Sep 25

Titan Biotech Ltd has announced 2:10 stock split, ex-date: 20 Feb 26

No Bonus history available

No Rights history available
Quality key factors
Valuation key factors
Technicals key factors
 Technical Indicator Scale: Bearish, Mildly Bearish, Sideways, Mildly Bullish, Bullish Turned
 Shareholding Snapshot : Mar 2026
Shareholding Compare (%holding)
Promoters
None
Held by 0 Schemes
Held by 0 FIIs
Titan Securities Ltd (33.59%)
Manish Goel (2.8%)
27.72%
Quarterly Results Snapshot (Consolidated) - Mar'26 - YoY

YoY Growth in quarter ended Mar 2026 is 38.84% vs -11.90% in Mar 2025
YoY Growth in quarter ended Mar 2026 is 66.17% vs -19.00% in Mar 2025
Half Yearly Results Snapshot (Consolidated) - Sep'25
Growth in half year ended Sep 2025 is 21.49% vs 6.19% in Sep 2024
Growth in half year ended Sep 2025 is 11.76% vs 3.23% in Sep 2024
Nine Monthly Results Snapshot (Consolidated) - Dec'25
YoY Growth in nine months ended Dec 2025 is 29.74% vs -2.30% in Dec 2024
YoY Growth in nine months ended Dec 2025 is 32.49% vs -11.94% in Dec 2024
Annual Results Snapshot (Consolidated) - Mar'26
YoY Growth in year ended Mar 2026 is 31.79% vs -4.64% in Mar 2025
YoY Growth in year ended Mar 2026 is 38.83% vs -13.36% in Mar 2025
About Titan Biotech Ltd

Company Coordinates


